- Polkadot price bounces off July 20 low at $10.37 to start a significant recovery.
- DOT’s V-shaped recovery could rally 21%
- Polkadot must overcome resistance at 100-day SMA, $14.2 and 200-day SMA to sustain the uptrend.
The Polkadot price is on a breakout, however for the rally to be sustained, DOT bulls to firm their grip. Polkadot is currently exchanging hands at around $12.9 on most crypto trading platforms.
Like many other assets, the last couple of days have seen DOT display a striking reversal. The Polkadot price has risen approximately 30% from Tuesday’s low at $10.37 and is aiming for more higher highs. This recovery has created a V-shaped chart pattern on the daily chart as bulls target gains beyond $15.
Polkadot’s V-shaped Recovery Targets $15.7
The Polkadot price has formed a V-shaped chart pattern on the daily chart, bouncing off the Tuesday low at $10.37. This indicates a striking reversal as bulls take control of the marker.
Note that V-shaped technical pattern was formed when DOT made a sustained uptrend following a massive price decrease that started on July 11. If this patterns holds, Polkadot will continue rising with a target beyond $0.25.
Polkadot price bullish thesis is accentuated by the Moving Average Convergence Divergence (MACD) indicator by it position above the zero line in the positive region. Moreover, the MACD line (blue) is positioned above the signal line which a further validation of the upward traction.
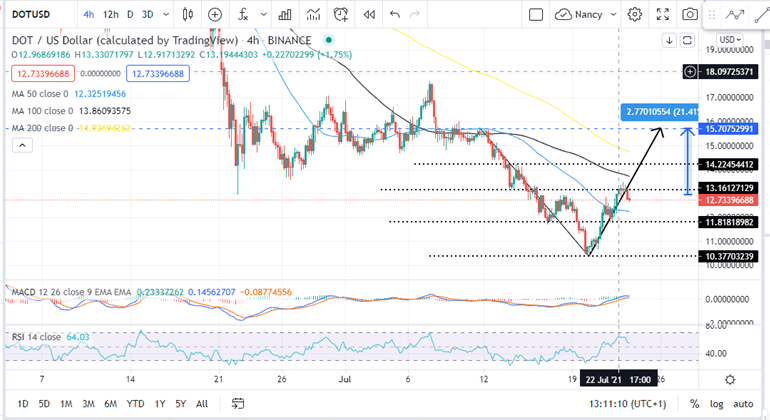
Polkadot Price (DOT/USD) Four-Hour Chart
Can DOT Sustain This Rally?
It is worth noting that Polkadot bulls have to overcome several hurdles before completing the recovery spelt by the V-shaped pattern. Currently, DOT faces immediate resistance at $13.16 which could force the Polkadot price to retrace back to the support level around $12.5 before starting another recovery.
Overcoming this hurdle will pitch the asset against other resistance levels at the 100-day Simple Moving Average ($13.7), $14.2 resistance level and the 200-day SMA at $14.7.
Note that bulls have to defend the immediate support at $12 and ensure a daily closure above the $13.16 resistance level. If this happens, bulls will be bolstered to overcome the said hurdles and test the $15 psychological level and beyond to the target at $15.7. This represents approximately 21% rise from the current price.
A look on the Other Side
Failure to close the day above $13.16 could invalidate the bullish rally and force a correction in a downward move. If this happens, Polkadot will forced to re-test the $13 and $11.8 support levels. Further retractions could see DOT re-visit the July 20 low at $10.3.
The possibility of this bearish outlook is validated by the Relative Strength Index (RSI) by its downward movement towards the midline.
Investors might have to wait for more crypto signals to see what happens to the Polka dot price before making any move in the near term.
Looking to buy or trade DOT now? Invest at eToro!
Capital at risk
