- Polkadot price trades in a second straight bullish session around $35.59.
- Polkadot remains bullish as it trades within the confines of an ascending parallel channel.
- DOT price prediction is bullish as it aims for a 23% rise to areas above the $44 level.
The Polkadot price bounced off the 200-day simple moving average (SMA) around $27.77 on September 09 suggesting that the bulls are aggressively defending this support level. Note that this is a major support level given that the bulls successfully held this level between August 20 and August 23.
The long lower wick on the September 08 red candlestick was an indication that the DOT price sentiment was reversing to positive and buyers were getting in on the dips. The MACD sent a call to buy crypto signal on September 13, an indication that the bulls were back in town.
Polkadot Price Aims For $44.45
The Polkadot price has spelt out an ascending parallel channel chart pattern on the daily chart. This is a significantly bullish chart pattern and as long as the DOT price remains within the confines of the rising channel, it will continue with the bullish momentum.
At the time of writing, DOT/USD price is trading in a second bearish session at $35.99 on most crypto exchanges and appears to be battling immediate resistance at the $37.51 level. Note that a daily closure above this level may see the Polkadot rise higher to tag the $40.0 mark. A clear bullish breakout will be achieved once DOT breaks above this level to tag the tip of the upper boundary of the ascending parallel channel at $44.45. This represents a 23% move upwards from the current price.
DOT/USD Daily Chart
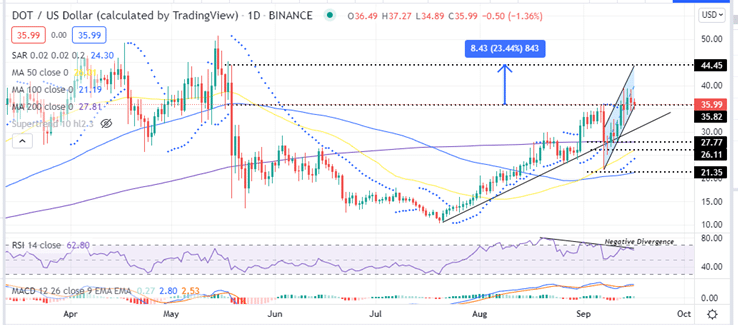
DOT’s bullish narrative is validated by the upsloping moving averages and the positive Parabolic SAR which indicates that the Polkadot price market momentum is bullish.
As noted earlier, the September 13 bullish signal from the MACD accentuates Polkadot’s bullish narrative. In addition, the current position of the MACD above the signal line and above the zero line in the positive region show that the asset’s market sentiment is positive.
These bullish technical indicators plus the fact that Polkadot sits on a strong support provided by particlarly the 200- day SMA at $27.77, the 50-day SMA around the $26.11 and the 100-day SMA at $21.35 validate DOT’s bullish bias.
The negative divergent RSI indicates that the bears have not given up on pulling the DOT price further down. If they manage to overpower the bulls and the current correction lingers, Polkadot may drop below the immediate support at $35.58 coinciding with the lower bundary of the ascending parallel channel. A drop further could see the Polkadot price drop outside the rising channel to tank below the $35.0 psychological leve to tag the $30 mark or the SMAs below it.
Looking to buy or trade Polkadot now? Invest at eToro!
Capital at risk
