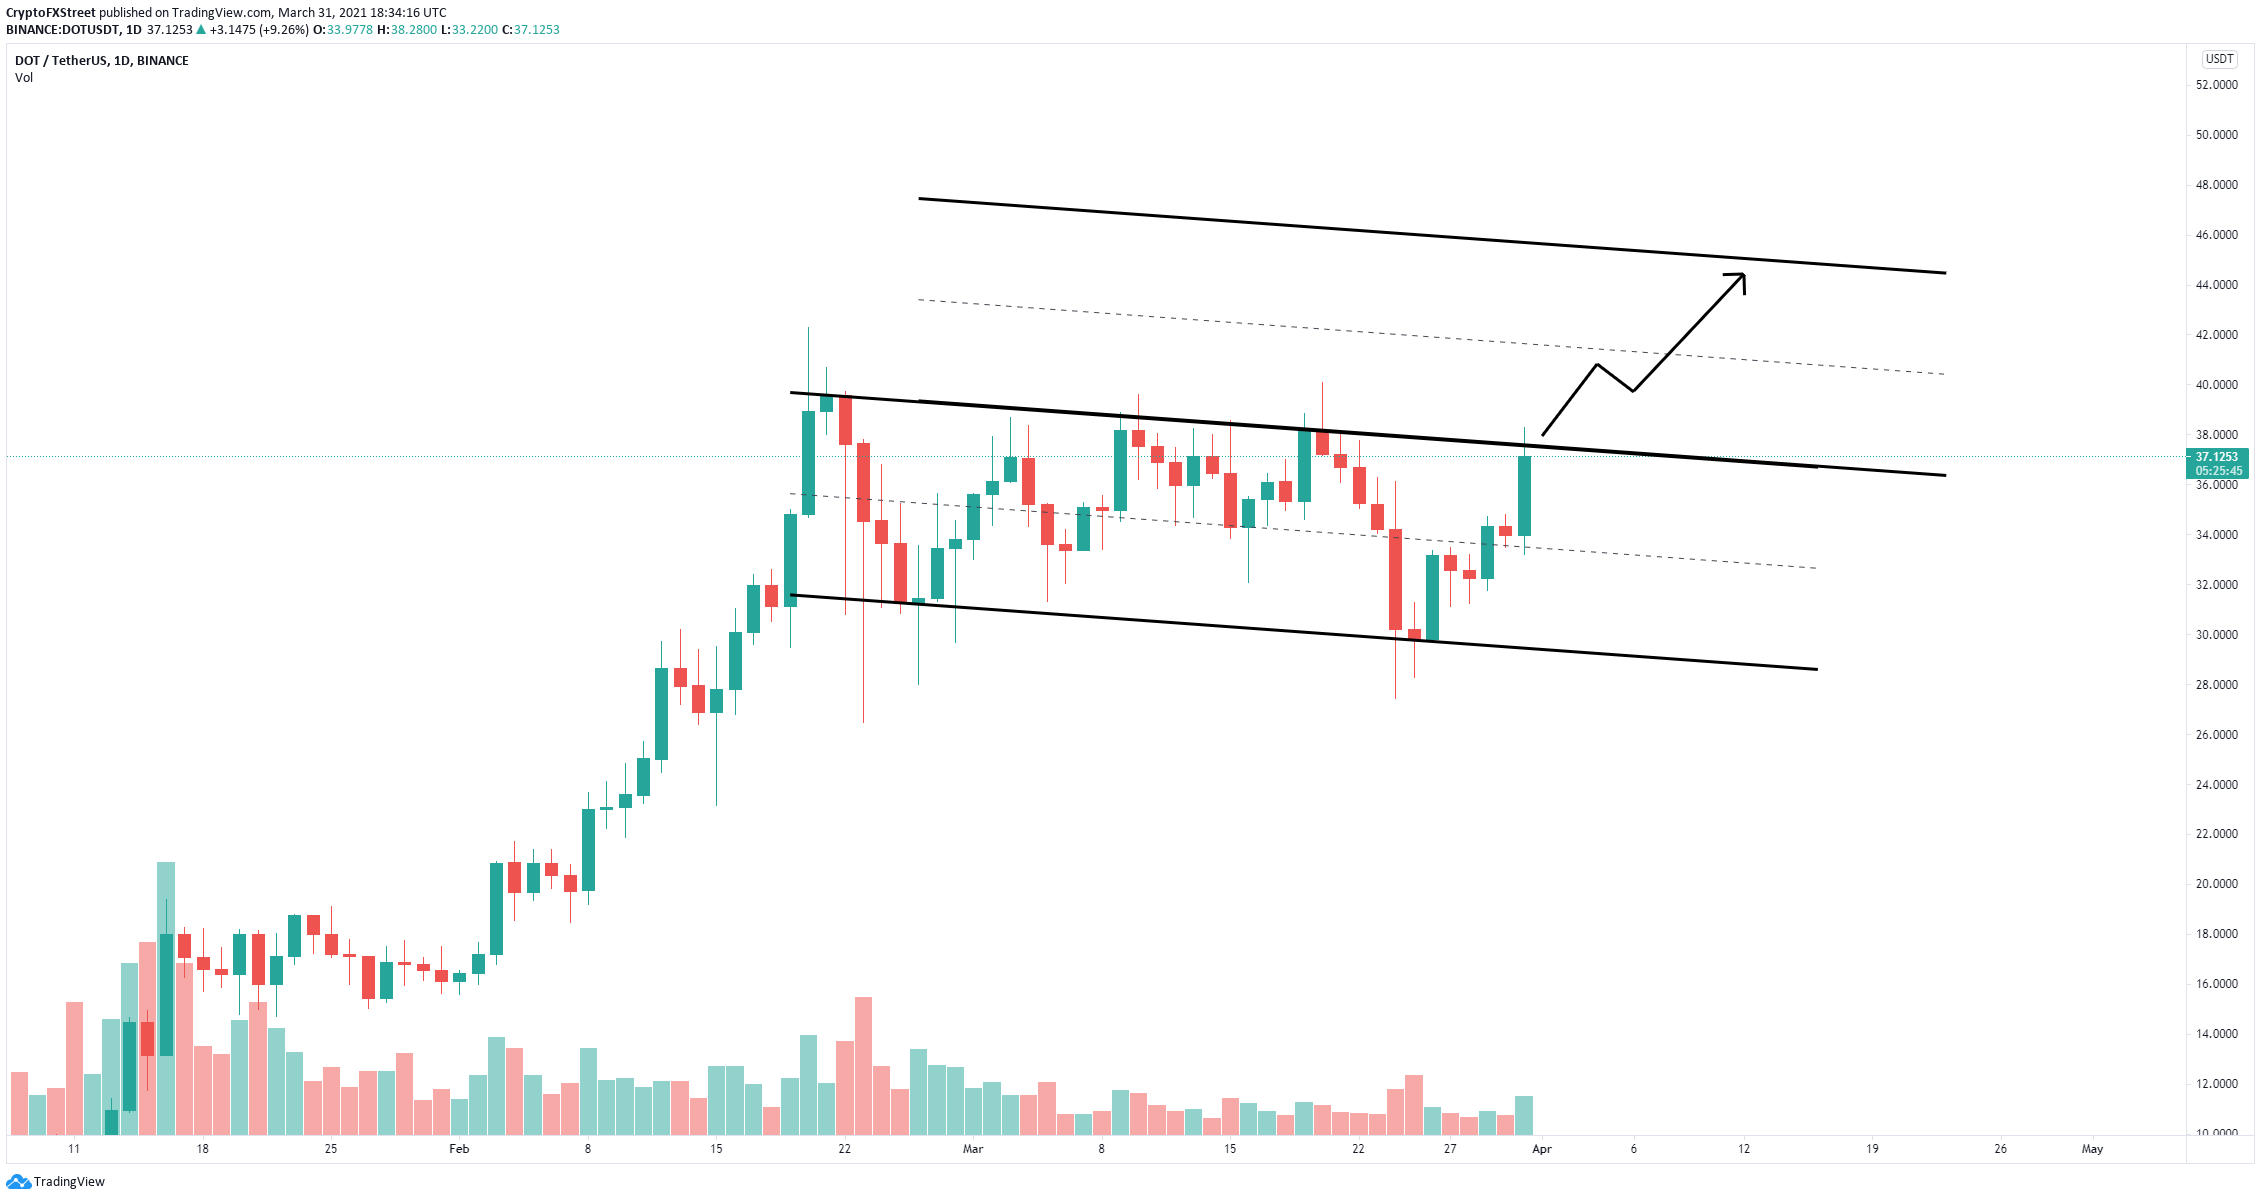
- Polkadot price is contained inside a descending parallel channel on the daily chart.
- The digital asset faces one critical resistance level before a potential 20% breakout.
- DOT is only 10% away from new all-time highs above $42.2 as the entire market turns green.
Polkadot had several significant breakouts in the past week, gaining 40% since March 24. The digital asset is on the path of new all-time highs with just one key resistance level ahead.
Polkadot price must climb above this trendline to see $40
On the daily chart, Polkadot has established a descending parallel channel with the upper boundary established at about $37.5. The digital asset is on the verge of cracking this point after forming a new daily uptrend.
DOT/USD daily chart
As there aren’t other essential resistance levels ahead, a breakout above $37.5 should quickly drive Polkadot price towards the previous all-time high of $42.28 and as high as $45 in the longer-term.
Nonetheless, a rejection from the upper trendline resistance of the parallel channel would be notable, with the potential to push Polkadot price down to at least the middle trendline at $33.3 and as low as $29.

