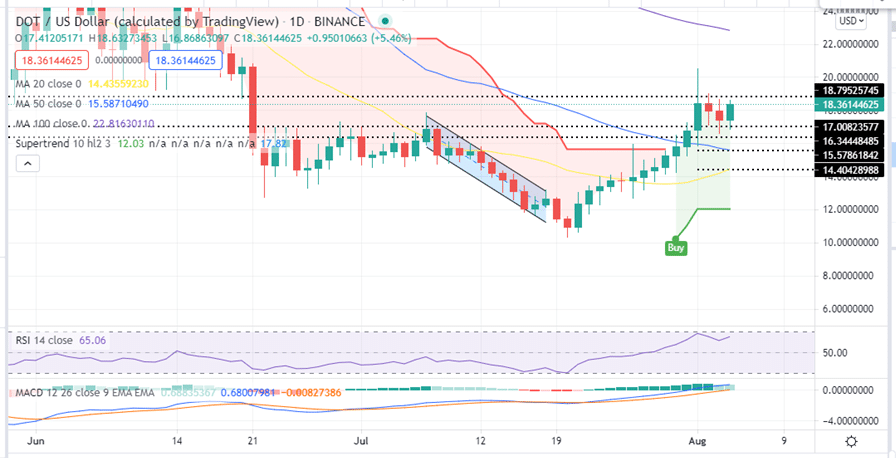
- Polkadot price has had two bearish sessions that saw it tank below $20.
- The general DOT price prediction is bullish as accentuated by multiple technical indicators.
- An upswing could see Polkadot reach explore areas around $22.
DOT has traded in the red for the past couple of days that has seen the Polkadot price below the $20 support wall. Prior to that, Polkadot had rallied approximately 90% from $10.93 on July 21 to highs of about $20.50 August 01.
This rally saw Polkadot flip the 50-day and the 100-day Simple Moving Averages (SMA) from resistance to support. It also reversed the market momentum from red to green.
This massive rally indicates that DOT could still be amongst the best cryptocurrency to buy and that the pull-back below $20 might be temporary.
Can The Correction In The Polkadot Price Be Reversed?
At the time of writing, DOT was exchanging hands in the green at around $18.29 and appears to be fighting immediate resistance at $18.79. Note that a daily closure above this level could bolster the Polkadot price rules to as they eye areas beyond the $20 psychological level.
The general DOT price prediction is bullish as accentuated by several technical crypto signals. For example, the appearance of an engulfing bullish candlestick indicates that bulls are back in town and are determined to regain the losses witnessed over the last two days.
Moreover, the Moving Average Convergence Divergence (MACD) indicator is positioned above the zero line. In addition, the movement of the 12-day EMA (blue line) above the 26-day EMA (orange) validates the uptrend. Therefore, it is expected that another considerable uptrend will occur to push the Polkadot even higher.
Note that the Relative Strength Index (RSI) is moving towards the overbought area indicating that bulls have gained more traction.
Furthermore, the SuperTrend indicator still shows the buy signal. Investors should keep in mind that the uptrend will continue as long as the Polkadot price remains above the SuperTrend line and above the descending parallel channel price range.
Polkadot Price (DOT/USD) Daily Chart
DOT Could Reach These Levels
Note that if the Polkadot violates the $18.79 major resistance level, it could trigger buying orders. If this happens, the DOT price could revisit areas around the $20 psychological level. A further rise would see Polkadot explore areas around $22 before meeting major resistance around $23.20.
On the downside, it is important to note that if Polkadot fails to hold the immediate support at $17.03, the fall will extend towards the $16.35 support wall.
If the support at $16.35 fails to hold, DOT might be forced to re-test the support at $15.57 where the 20-day SMA is sitting or the 50-day SMA at $14.40.
Looking to buy or trade Polkadot now? Invest at eToro!
Capital at risk
