- Polkadot price frustrated by the February high at $42.72.
- DOT has experienced an unprecedented amount of development and adoption over the past year.
- “The Internet of Blockchain” rewarding patient investors in 2021.
Polkadot price failed on its first attempt to break out above the February high at $42.72 and is currently resetting just above the 21-day simple day moving average (SMA). The setback is mild and on low volume, keeping the emphasis on the bullish outlook moving forward.
Polkadot price needs to play catch-up with the cryptocurrency complex
The DOT ecosystem is being adopted by a growing number of developers, including many switching from other protocols limited in their functionality across blockchains. In particular, its high speed in processing transactions coupled with its interoperability has captured the attention of a legion of non-fungible token (NFT) developers in 2021.
During March, DOT consolidated the February crash in a parallel channel on meager volume. The resulting breakout to the upside in April led to an all-time high, but the altcoin could not generate price traction and has since fallen back in the pattern. It is a noteworthy divergence with the broader cryptocurrency market’s improved performance, but the charts indicate that it should be temporary.
First, DOT needs to reclaim the February high at $42.72 on a weekly close. A daily close is not enough to prove itself. If it does trigger the weekly close, the bullish outlook projects a test of the 161.8% Fibonacci extension of the February bear market at $53.16 followed by a push to the 261.8% extension level at $70.06, representing a gain of over 60% from the current price.
Speculators should not be surprised by a rally extension to the 361.8% extension at $86.96.
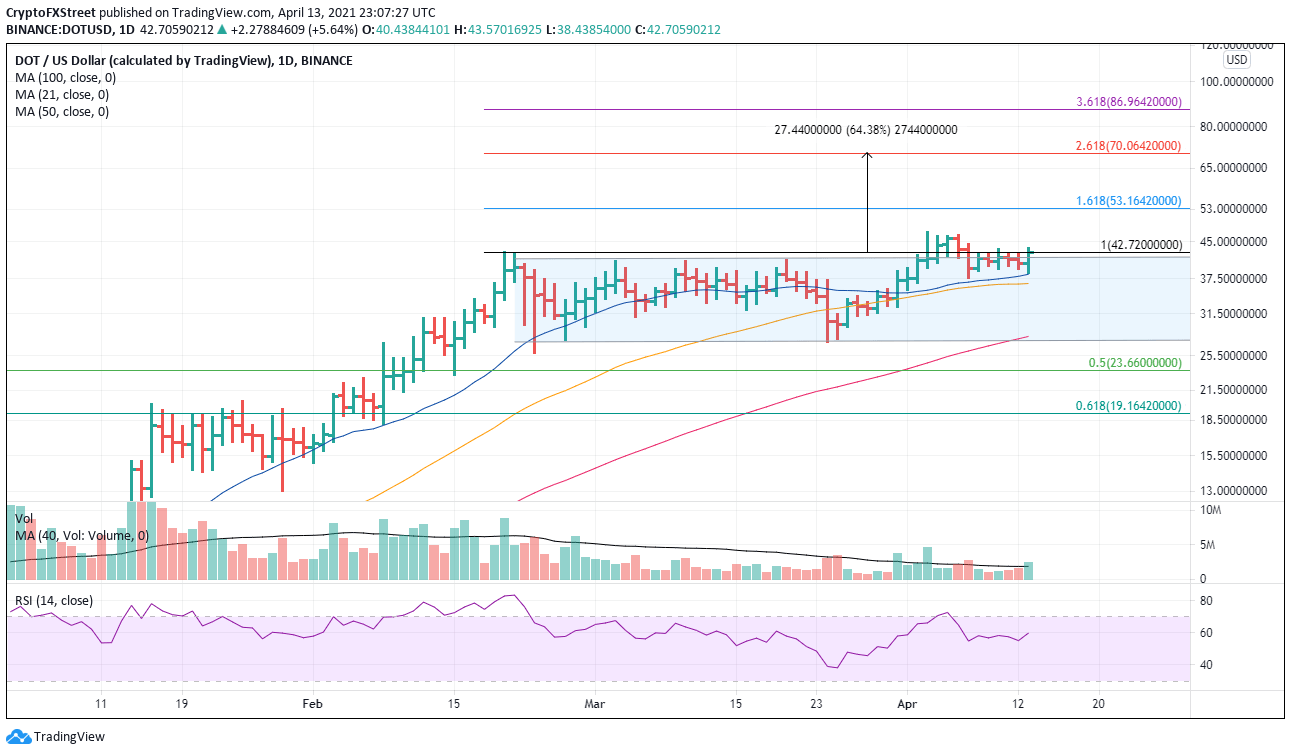
DOT/USD daily chart
On the other side of the fence, speculators need to monitor DOT’s divergence with the larger cryptocurrency market. If it persists while the broader strength continues, it could indicate the market is uncertain about the short-term fundamental story.
The 50-day SMA is the first level of support at $36.57 and then the convergence of the March low at $27.30 with the 100-day SMA at $28.09. Any further weakness will catch support at the February low at $25.83.
