- Polkadot price fails to impress this week as the broader cryptocurrency market shines.
- Price compression will lead to price expansion to the upside.
- Polkadot Index Network Token (PINT) gives holders access to the top projects.
Polkadot price is trading in a tight weekly range and may close with a second consecutive inside week. The current outlook projects that the last two weeks’ price compression will release to the upside and carry DOT to the 261.8% Fibonacci extension at $70.06.
PINT creators envision it as a “treasury reserve asset” for the Polkadot ecosystem
As one of the fastest-growing interoperable blockchains and backed by the Web3 Foundation, DOT has captured special interest from developers and investors and is the home of literally hundreds of projects in development.
To ease the burden of combing through the projects, the Polkadot Index Network Token will enable investors to make a diversified wager on the total ecosystem and permit instant access to the leading projects.
Chainsafe said it would soon launch PINT in collaboration with PoS infrastructure provider Stateless money.
PINT will be split into four partners: Stateless Money, Chainsafe, a PINT council of Polkadot experts, and a Constituent Committee that includes a representative from each project with assets in the index.
Already, six projects have given preliminary commitments to being part of the index, including Acala, Equilibrium, HydraDX, Litentry, Moonbeam, and Plasm.
Polkadot price needs to reclaim the February high on a weekly close
A daily close above the February high may be enough for very short-term speculators, but a weekly close raises the probability of success. If DOT does trigger, the bullish outlook projects a test of the 161.8% Fibonacci extension of the February bear market at $53.16 followed by a push to the 261.8% at $70.06, representing a gain of over 60%.
If the rally commands volume, it should reach the 361.8% extension at $86.06 in the medium term.
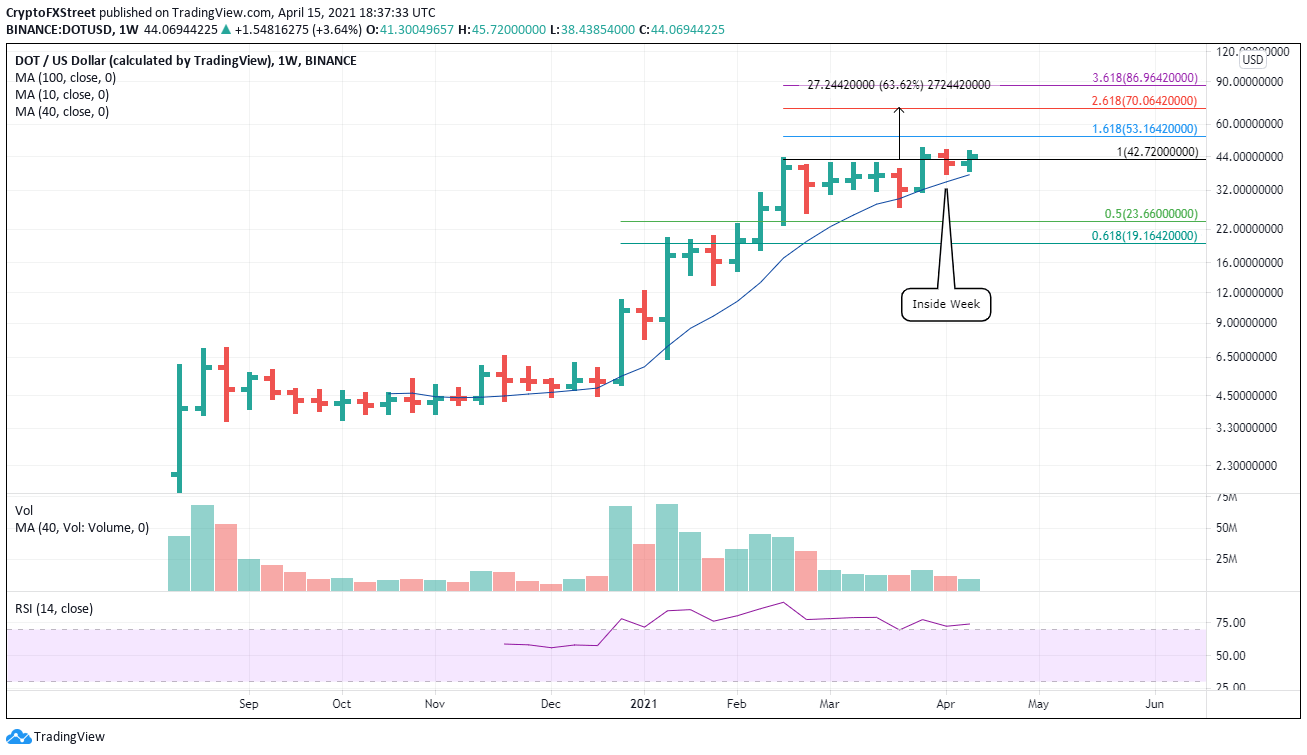
DOT/USD weekly chart
To play devil’s advocate, speculators need to monitor DOT’s divergence with the broader cryptocurrency market. If it persists, it could indicate the market is questioning the quickly evolving fundamental story.
The 10-week simple moving average (SMA) at $37.06 is the first significant support level. The next level is the March low at $27.30, followed by the February low at $25.83.
