- XRP/USD is currently trading for $0.265 in the early hours of Thursday.
- Relative strength index (RSI) indicator is trending around 36.
XRP/USD has fallen from $0.266 to $0.265 in the early hours of Thursday. Over the last four days, the price of Ripple has fallen from $0.284 to $0.265. The hourly breakdown for Wednesday shows that the price fell from $0.274 to $0.26, where it found support and went up to $0.266. The 200-day simple moving average (SMA 200) has crossed over the SMA 50 curve, charting the bearish “death cross” pattern. Since the formation of the pattern, XRP/USD had a heavily bearish day (August 14), and then it consolidates for a bit before it has a bullish breakout on August 18. Since then, the price met resistance at the downward trending line and has been sinking since then.
XRP/USD daily chart
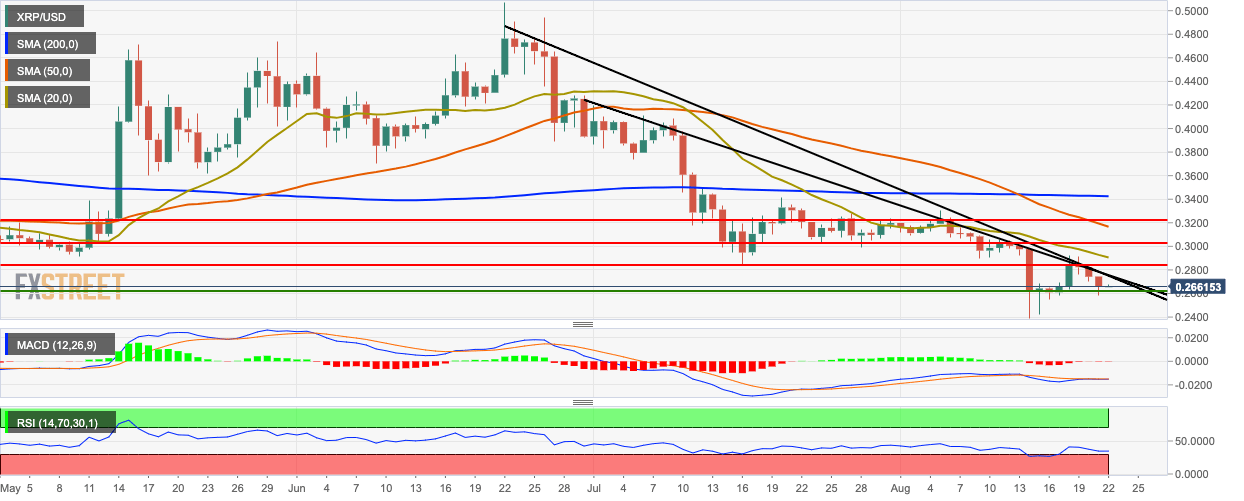
The market is trending below the SMA 200, SMA 50 and SMA 20 curves. The moving average convergence/divergence (MACD) indicator shows nine straight bearish sessions. The relative strength index (RSI) indicator has taken a drop and gone down to 36, right next to the oversold zone.
