- XRP/USD breaks above the bullish flag pattern resistance.
- A step above $0.31 will see gains towards $0.32 supply zone.
A weak bullish trend is currently sweeping across the market. Ripple is leading the recovery with subtle gains of 0.34. Ethereum and Bitcoin Cash are following closely after correcting higher 0.25%. However, the largest asset by market capitalization, Bitcoin is still leading from behind with losses amounting to 0.14% on the day.
As predicted in an earlier published article, XRP has broken above the bullish flag pattern resistance. The move is currently paving the way for gains that could soon touch $0.3. However, at the moment, XRP/USD is dancing with $0.3061.
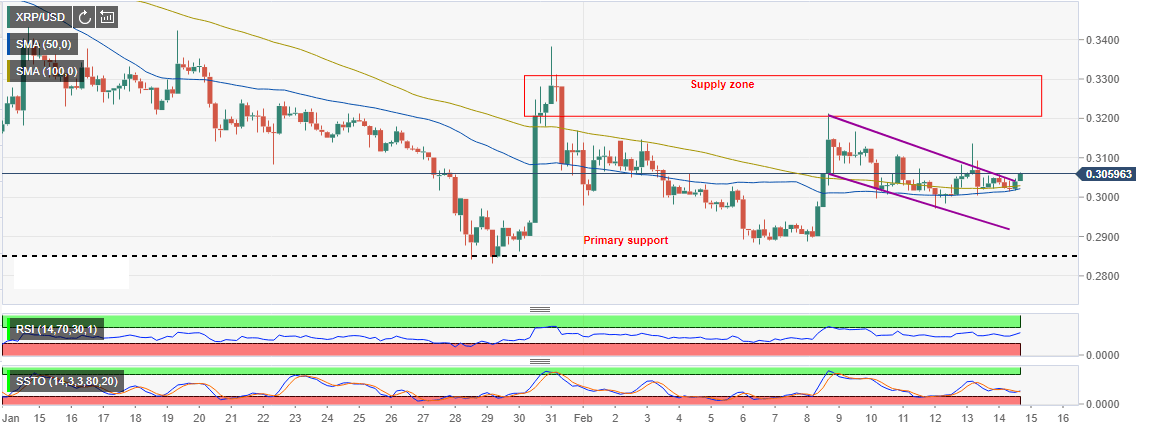
Slightly below the current market value of Ripple, the 4-hour 100-day Simple Moving Average (SMA) offering support. The next support rests with the 50-day SMA in the same range. If Ripple was to slide below these levels, we could see it test $0.3. Further correction to the downside, will find support at $0.29.
On the upside, a step above $0.31 will see gains towards $0.32 supply zone and $0.33 critical resistance in the medium-term.
XRP/USD 4-hour