- XRP is currently at a significant support level at around $0.2340.
- A defense of this crucial point would indicate a strong buy signal in the short-term.
XRP is trading at $0.2340 after the notable crash on September 2. Bulls have been able to defend the daily 200-MA several days in a row as the trading volume continues dropping and the RSI gets closer to the oversold zone.
XRP/USD daily chart
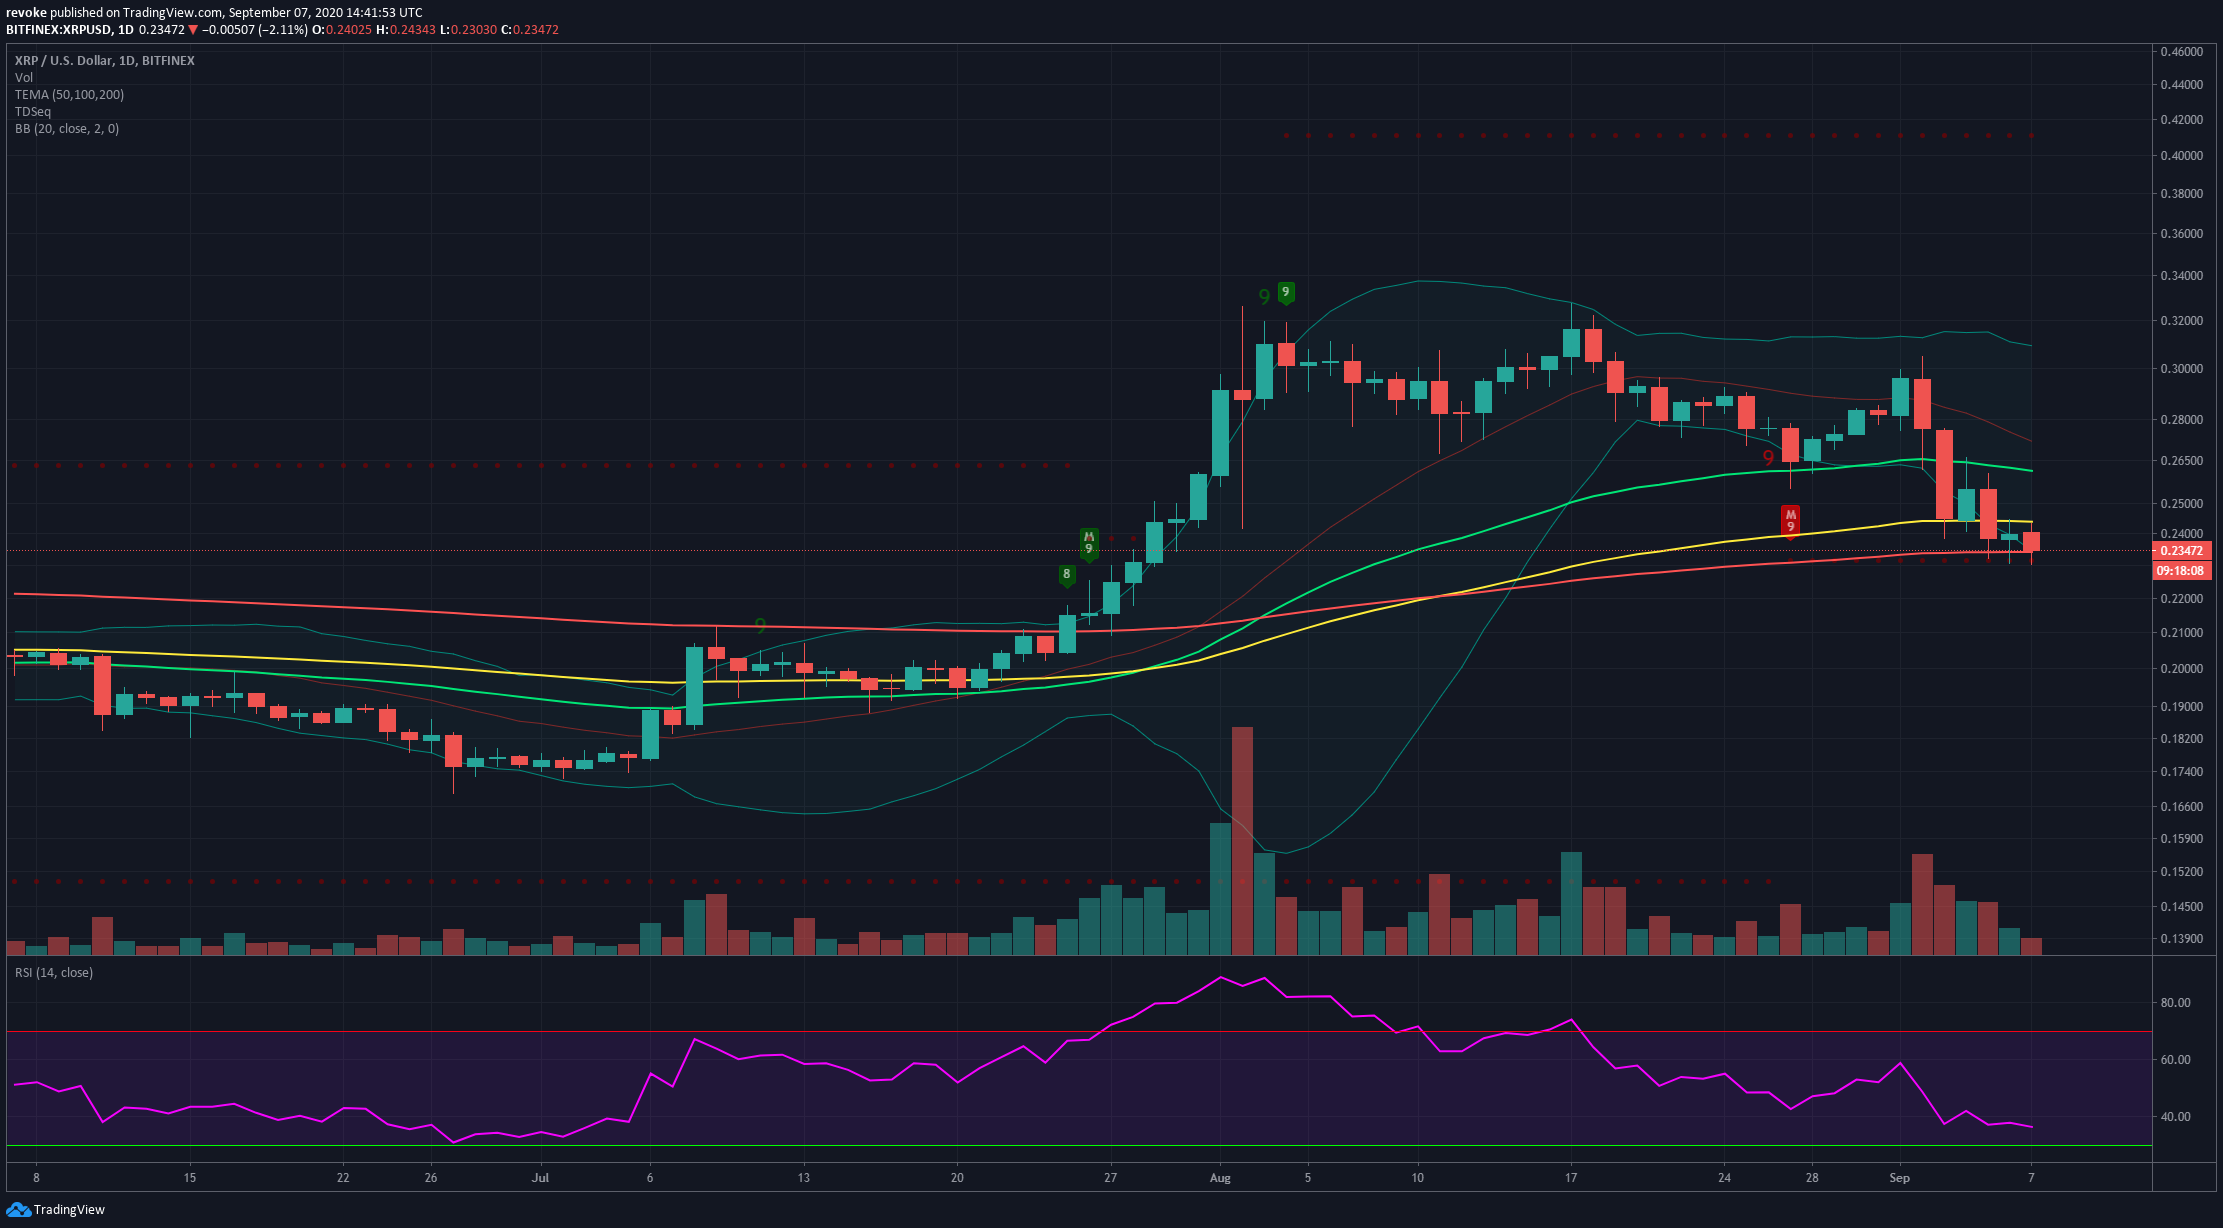
We can clearly see how the 200-MA is acting as a strong support level, further strengthened by the extended RSI and the lower line of the Bollinger indicator. At the same time, XRP price is getting rejected from the 100-MA, currently established at $0.2439.
XRP/USD 12-hour chart
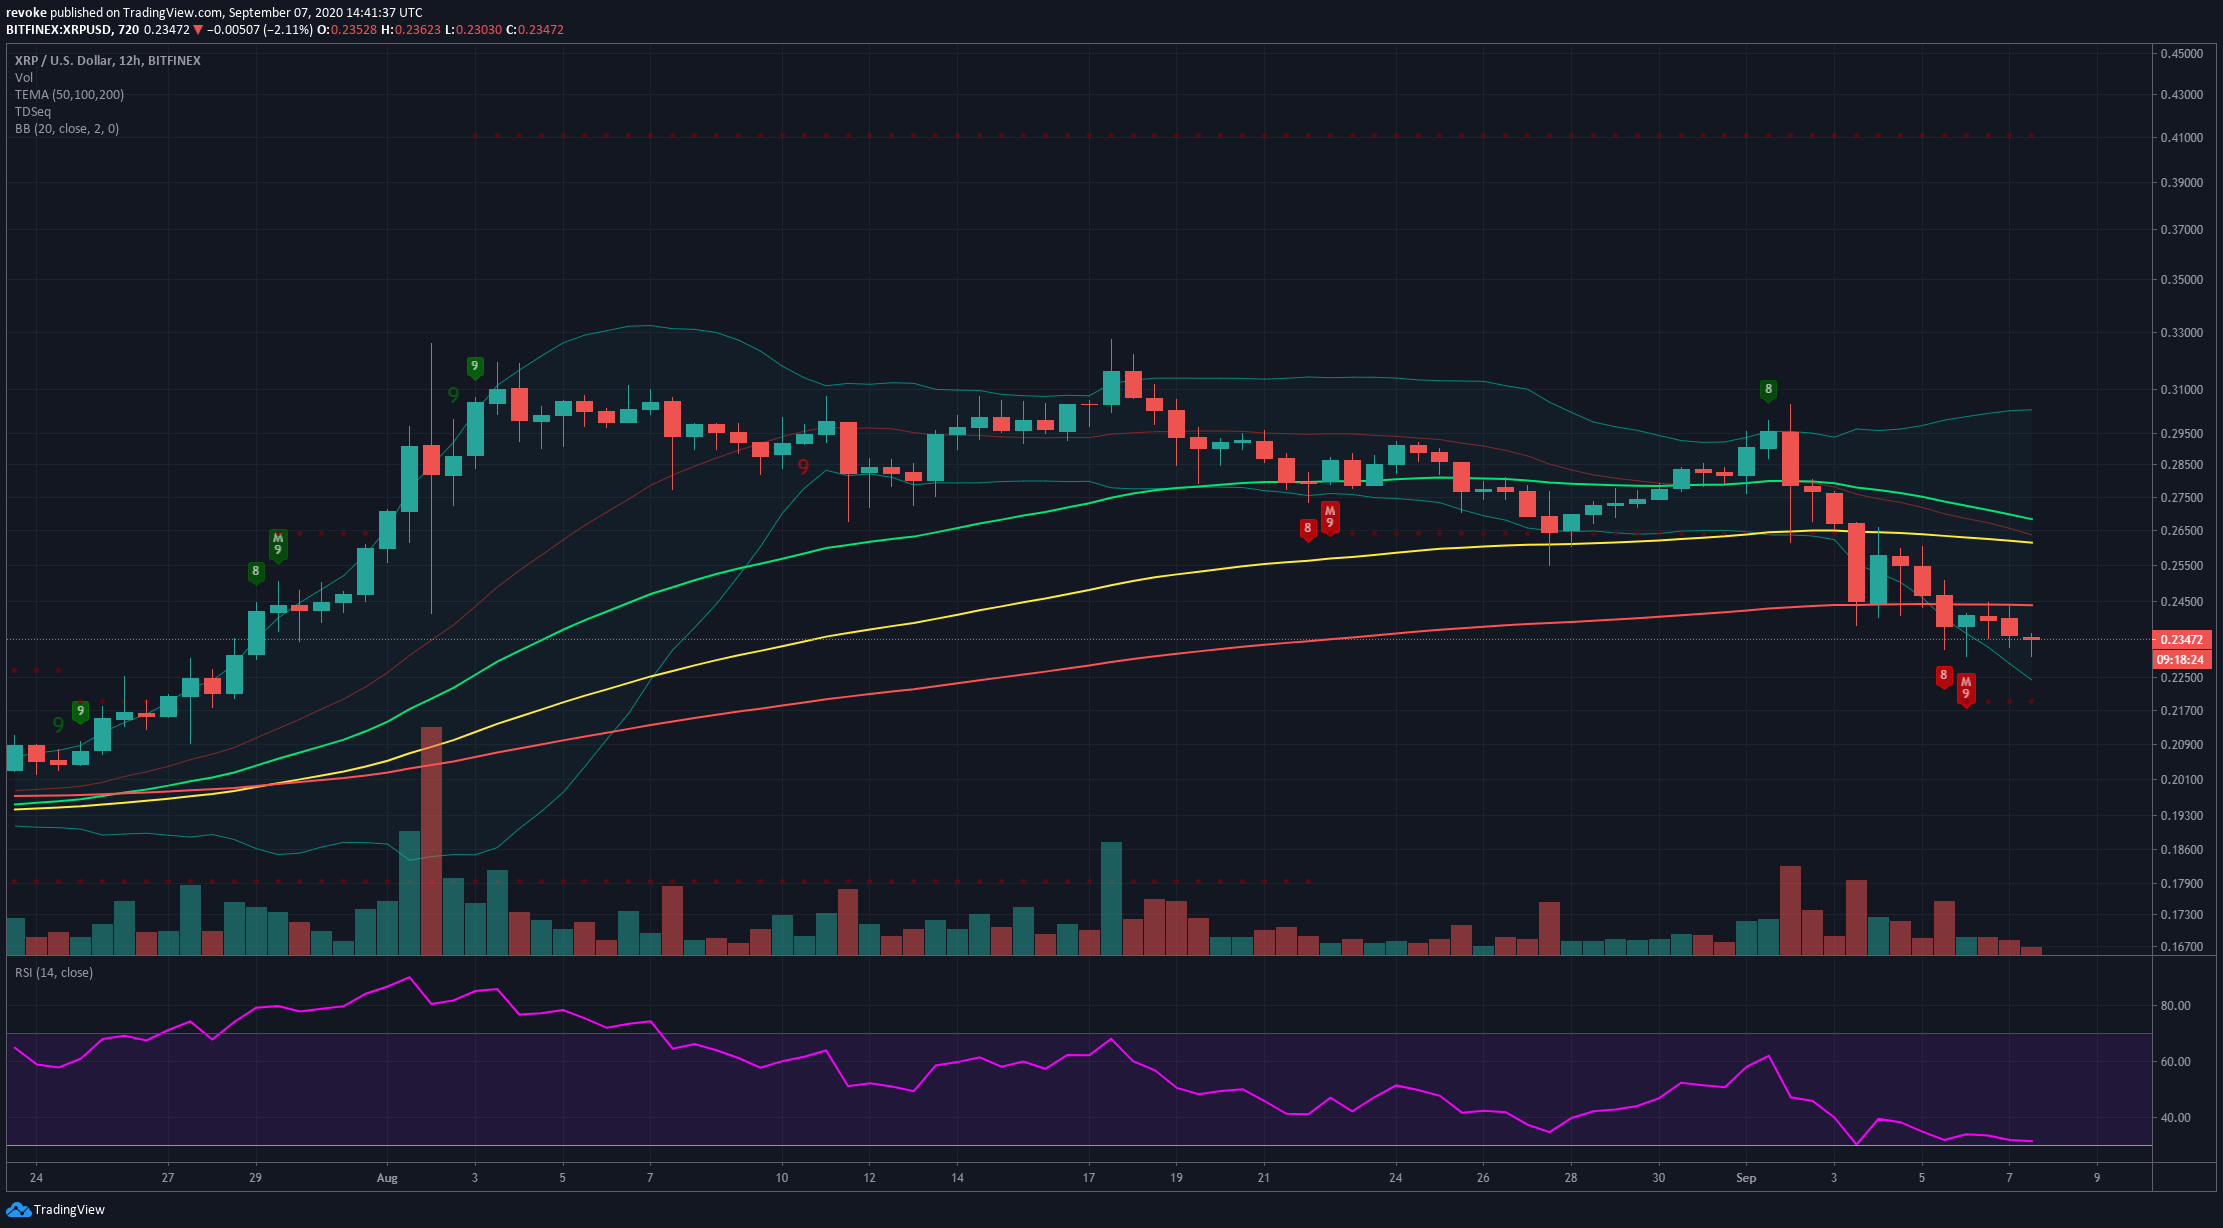
The TD sequential sent a strong buy signal on the 12-hour chart at around $0.23. The RSI is overextended and trading volume has been dropping for the past three days. The 200-MA is the one acting as a resistance level here, established at $0.2438.
The next target for an upward move would be $0.26, right below the 100-MA and the 50-MA.
XRP/USD 4-hour chart
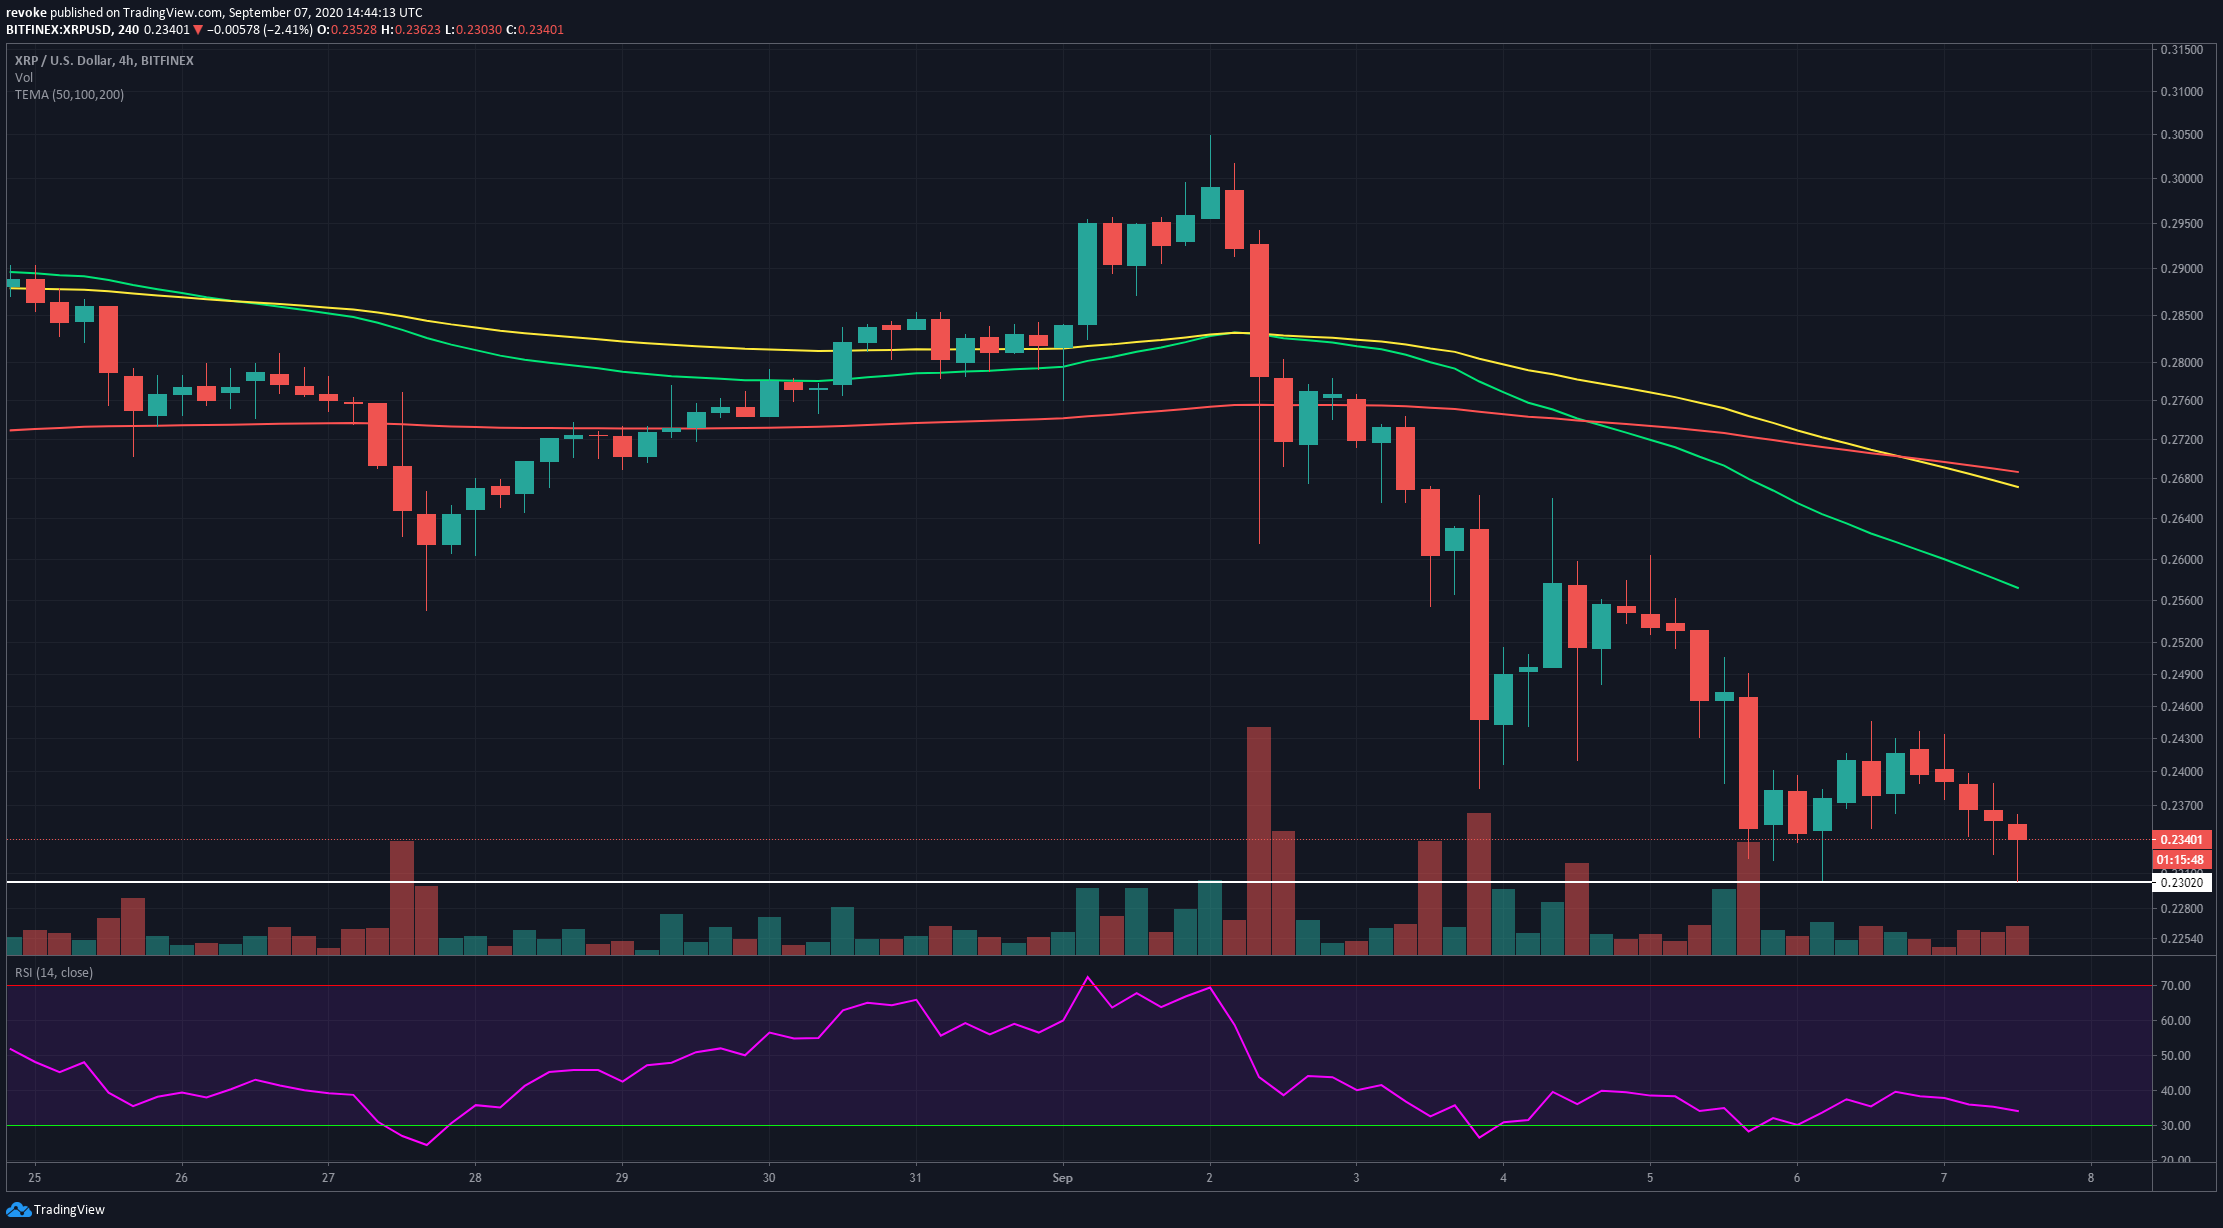
Zooming in even more, bulls have just established a double bottom that is not fully confirmed. If XRP can close above $0.23, this pattern will further confirm the strong buy signal on the 12-hour chart.
Moving averages are notably higher than the current price on the 4-hour chart and will eventually act as resistance levels.
