- XRP/USD is rising modestly following Friday’s correction.
- Next key resistance for Ripple aligns near $0.2550.
- 100-day SMA continues to act as a dynamic support.
Ripple (XRP/USD) rose above the key Fibonacci resistance (50% retracement of July-August rally) located near $0.2550 on Thursday but closed the day below that level following a late pullback. The pair stayed in consolidation on Friday and edged slightly higher on Saturday. As of writing, Ripple was up 0.5% on the day at $0.2525
Ripple technical outlook
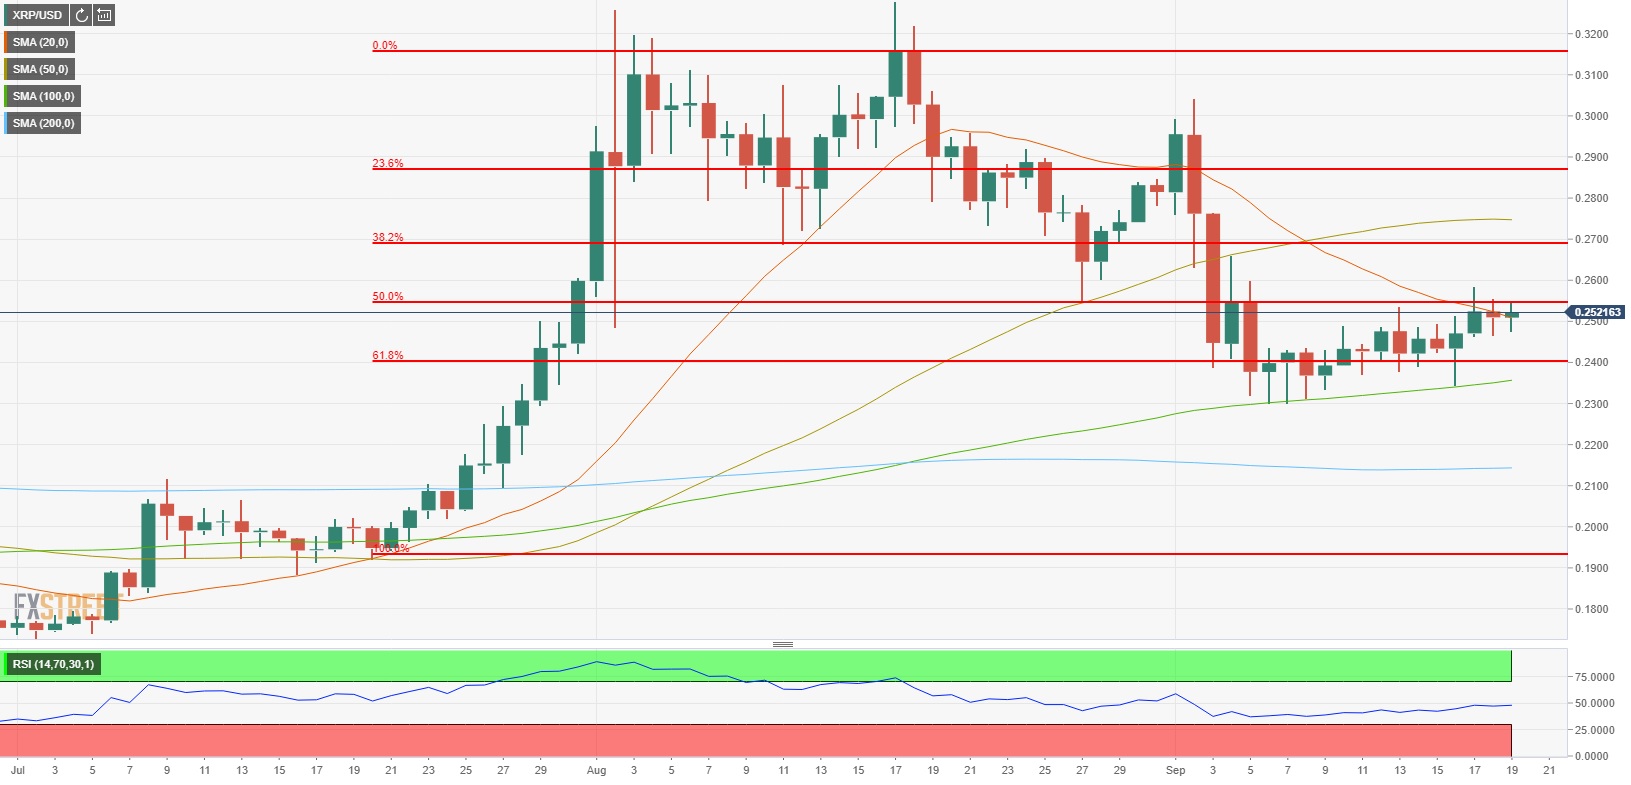
If Ripple manages to make a daily close above $0.2550, it could target the Fibonacci 38.2% retracement level at $0.2700. However, the Relative Strength Index (RSI) is moving sideways near 50 on the daily chart, suggesting that the pair is having a difficult time gathering bullish momentum.
On the downside, Fibonacci 61.8% retracement seems to have formed an interim support at $0.2400 ahead of the critical 100-day SMA currently located at $0.2360. In the past two weeks, Ripple tested the latter four times and managed to stage a rebound after each attempt. With a daily close below the 100-day SMA, the near-term outlook could turn bearish and the pair could target the 200-day SMA at $0.2150.
XRP/USD daily chart