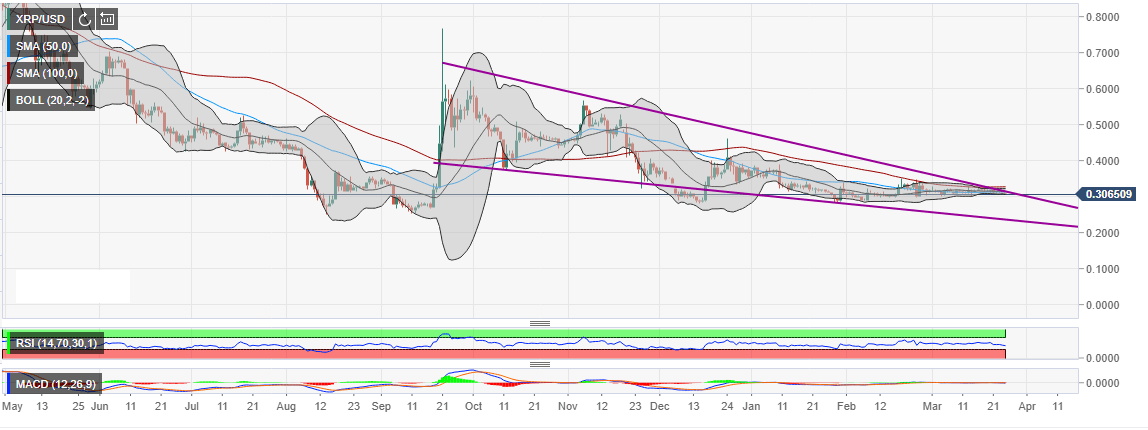
- Both the 50 SMA and the 100 SMA are limiting upward movements at $0.3189 and $0.3298 respectively.
- The current consolidation is likely to culminate in further declines.
XRP/USD daily chart shows a cryptocurrency that is struggling to escape the long-term bear pressure. The price is battling with the resistance from the six-months-long falling wedge pattern. Besides, both the 50 SMA and the 100 SMA are limiting upward movements at $0.3189 and $0.3298 respectively.
The technical levels for this pair are getting bearish with each coming day. Take the RSI, for instance, is on a downward trend at 41.37. Moreover, the indicator has not been able to pass the 65 mark since January 2019. The MACD, on the same chart, has been flirting with the mean line (0.0) unable to make any significant movements into the positive territory. In addition to that, the 50 SMA is under the longer term 100 SMA to show that the bears are still in control.
The current consolidation is likely to culminate in further declines according to the trend shown by the Bollinger Band daily. However, if the bull can manage to push the price above the falling wedge pattern resistance, we could see a reversal towards $0.5. Meanwhile, initial support is $0.30 while the next support target is $0.28.
XRP/USD daily chart

