- Ripple price is trading in a classic falling wedge pattern after losing momentum from last week’s high slightly below $0.52.
- The 100 SMA and the 200 SMA will offer resistance at $0.463 and $0.467.
Ripple has turned bearish on Monday morning (GMT) after trading slightly above $0.46. The price is battling for support above the 23.6% Fib retracement level between the highs of $0.51 and the lows of $0.43. The broken support at $0.46 will work as a resistance during the next upside attempt.
Significantly, the moving averages are present a couple of resistance areas. For instance, the 100 SMA at $0.463 and the longer term 200 SMA will prevent gains at $0.467. Ripple is correcting lower in a falling wedge pattern after the bullish trend that tested the critical resistance last week at $0.52.
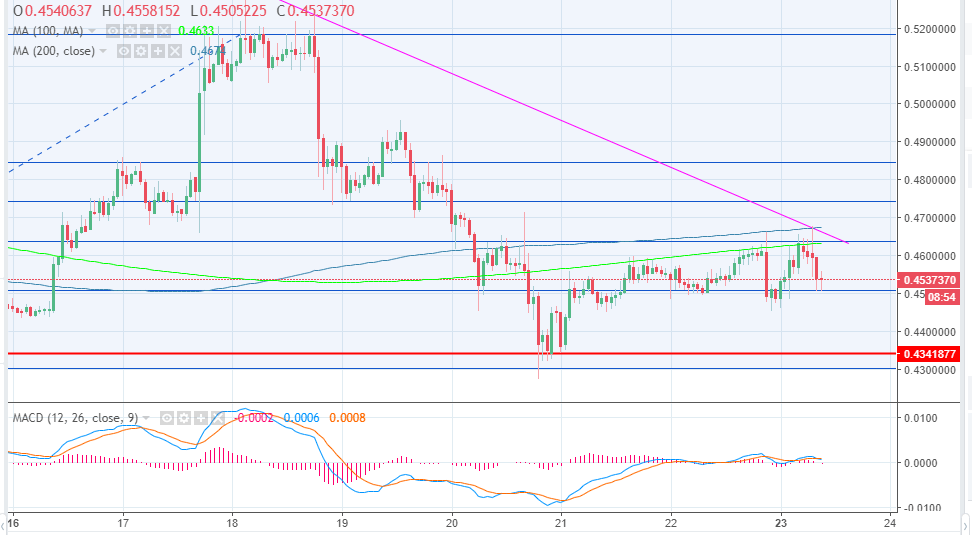
Technical indicators on the 2-hour chart are currently sending bearish signals for the short-term. The stochastic has changed direction downwards, besides it is at 47%. The MACD momentum indicator is still on the positive territory but it is approaching the negative area. Ripple must keep the 23.6% Fib support marginally above $0.45 to avoid further declines.
XRP/USD 2-hour chart