- XRP/USD is clinging to small daily gains on Saturday.
- $0.23 is the next line of defence ahead of $0.22.
- Strong resistance seems to have formed near $0.26.
Ripple (XRP/USD) closed the previous three days in the negative territory and touched its lowest level in nearly a month at $0.2322 on Friday. Although the pair erased a large portion of its losses before closing near $0.24, it struggled to gather further bullish momentum on Saturday. As of writing, XRP/USD was up 0.5% on the day at $0.2407.
XRP/USD technical outlook
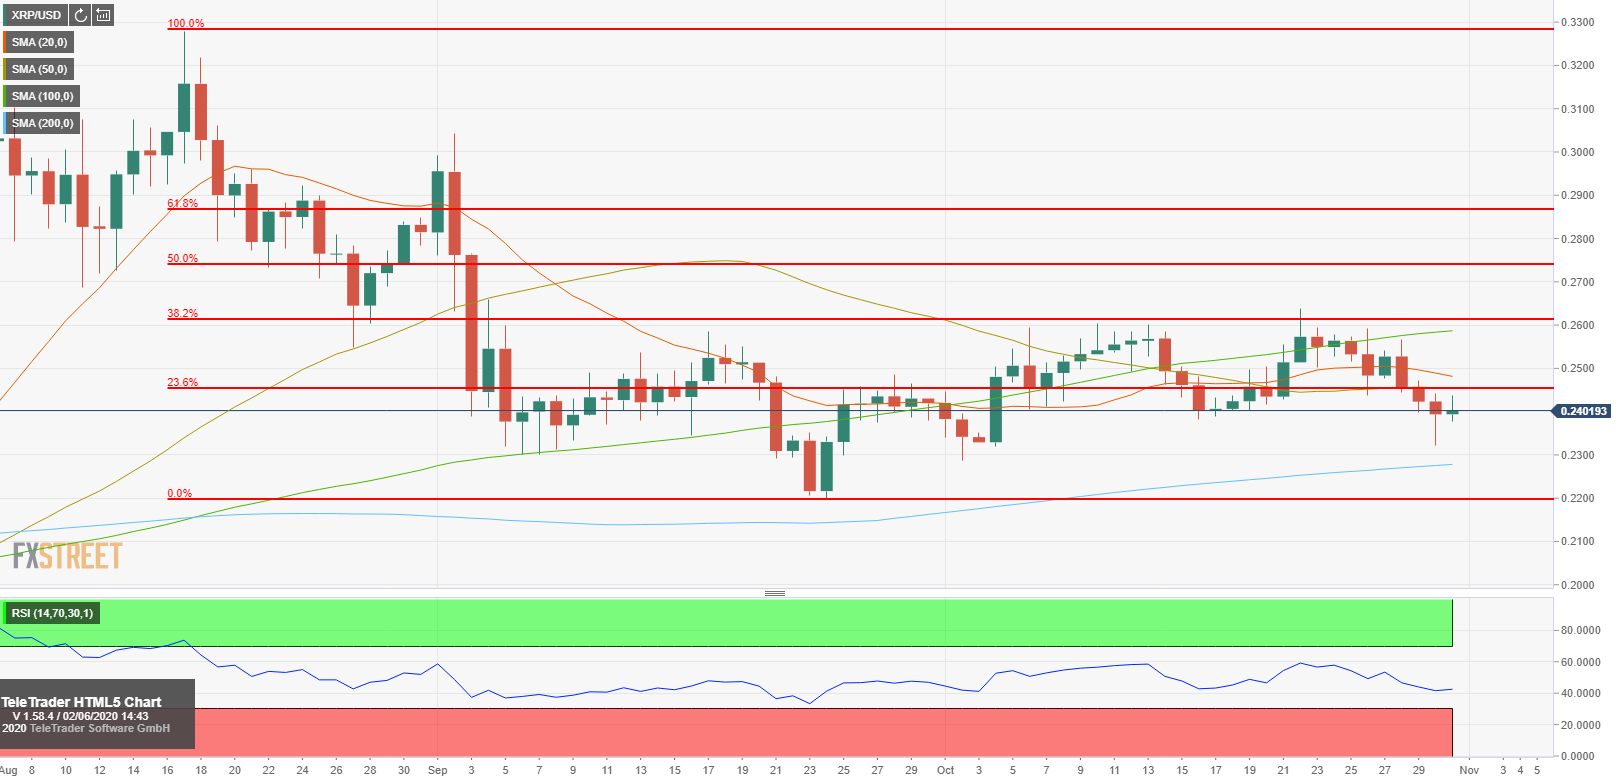
The Relative Strength Index (RSI) indicator on the daily chart remains below 50 and both the 20-day and the 50-day SMAs continue to float above the price, suggesting that market participants haven’t committed to a decisive rebound yet. On the downside, strong support seems to have formed near $0.23, where Friday’s low and the 200-day SMA are located. With a daily close below that level, XRP/USD could extend its decline to $0.22 (September 23 low/ starting point of the mid-August-October decline).
The initial resistance is located at $0.2450 (50-day SMA/ Fibonacci 23.6% retracement). If the pair manages to hold above that level, sellers are likely to look to retake the control of the price around $0.26 (Fibonacci 38.2% retracement/100-day SMA).
Ripple daily chart