- Bulls appear to be taking a breather as they gather the strength to retrace the steps towards $0.4000.
- XRP/USD hints consolidation as volatility levels come down.
Ripple is finally calm after the storm that has been sweeping across the market since Wednesday morning. Following last week’s loss from 2019 high at $0.47, XRP/USD had found support at $0.3600: making a confluence with the 38.2% Fib retracement level between the last swing high at $0.47 and a swing low of $0.2929 and the 100 Simple Moving Average (SMA) 4-hour.
Bitcoin instigated declines saw the price plunge from the tight range between $0.3800 and $0.400. Unlike Bitcoin which spiraled almost hitting $7,500, Ripple controlled the fall slowing down the losses at $0.3600 as mentioned. Bulls appear to be taking a breather as they gather the strength to retrace the steps upwards.
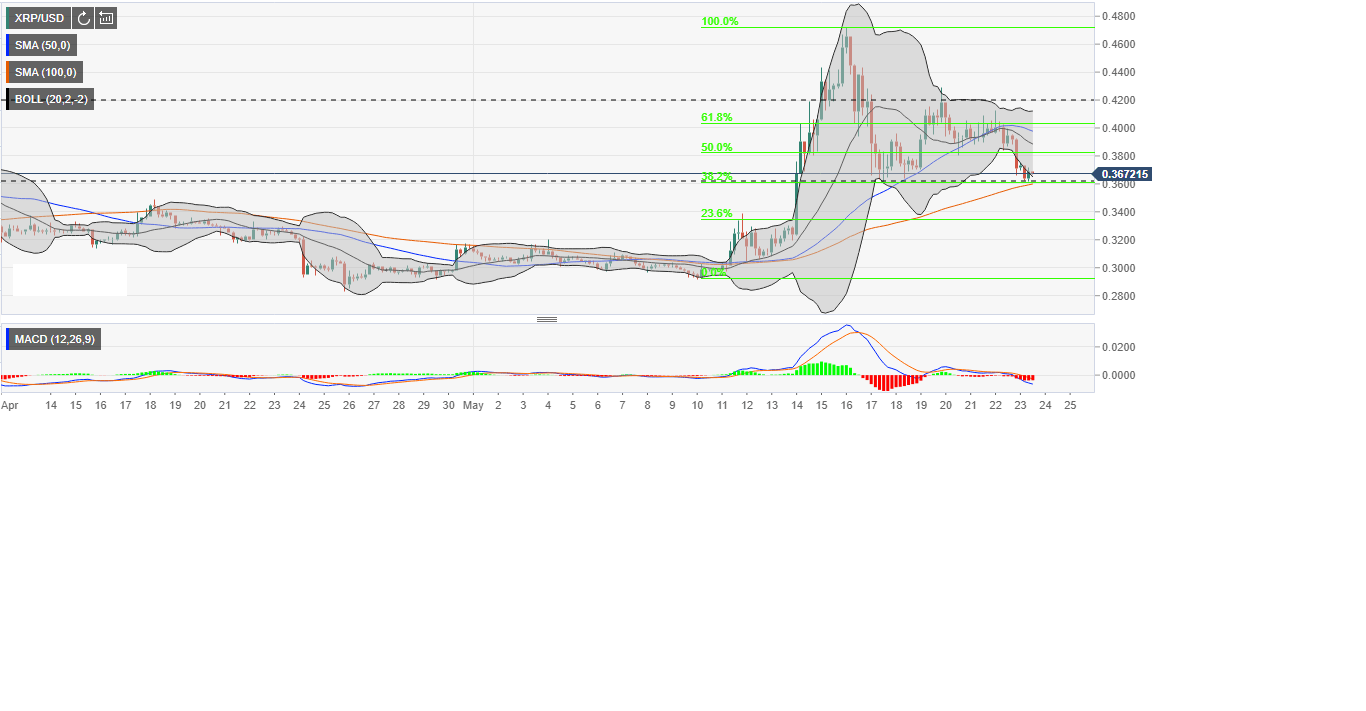
The price is currently dancing with $0.3678 supported by the Bollinger band lower layer. The Bollinger Band shows decreasing volatility as we move towards consolidation following the surge experienced last week. The Moving Average Convergence Divergence (MACD) is, however, falling deeper in the negative. Meaning that the trend is inclined to the south in the near-term. As long as the price is kept above $0.3600, we could see a correction above $0.4000.
XRP/USD 4-hour chart