- Ripple whales have been on an accumulating spree since mid-October.
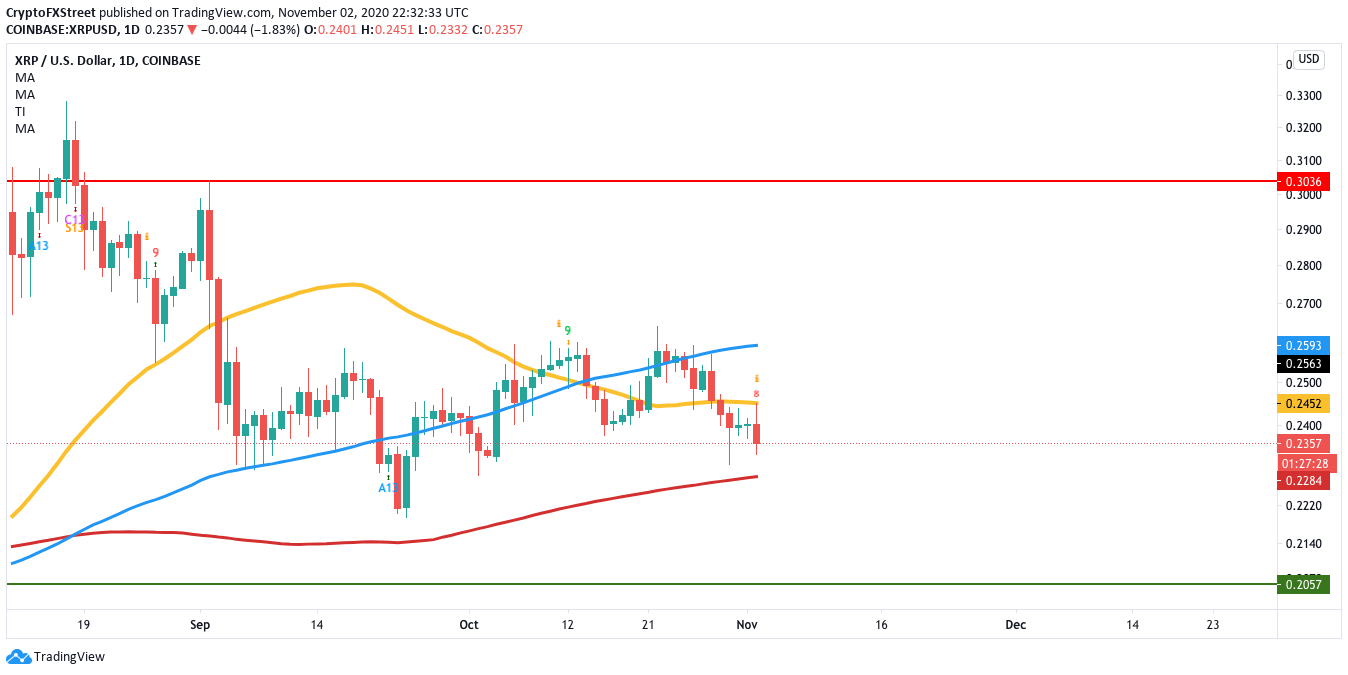
- XRP’s daily chart shows that it is on the verge of flashing the buy signal via the red-nine candlestick.
Ripple rose from $0.24 on October 12 to $0.26 on October 23. Since then, the price has been on a massive downtrend, having dropped to $0.235 at the time of writing. However, technical analysis reveals that the buyers are going to come roaring back soon.
Buyers looking to do a comeback
XRP/USD daily chart has started flashing the TD sequential indicator’s buy signal with a red-nine candlestick. If this outlook is validated, the cross-border remittance token should be able to break past the 50-day SMA ($0.245). After breaking past this barrier, the next strong resistance zone lies at the 100-day SMA ($0.26). If the bulls stay strong, Ripple may break above this and reach $0.3.
XRP/USD daily chart
Adding further credence to the bullish outlook is the way the holders have been behaving since mid-October. Santiment’s holders distribution chart shows us that the number of addresses holding 1 million to 10 million tokens has been increasing steadily. There was a significant dip on 27-29 October, before it shot up from 1,336 to 1,342 at the time of writing.
Ripple holders distribution
Can the bears take back control?
The bears can invalidate the buy signal and take the price down to the 200-day SMA ($0.228). The 200-day SMA has historically acted as a strong resistance level, so it should be able to absorb a large amount of selling pressure. Any further break will take XRP down to the $0.2057 support wall.
Key price levels to watch
XRP bulls have to overcome the 50-day SMA ($0.245) and the 100-day SMA ($0.26). If they manage to do that, the price should be able to reach $0.30.
On the downside, the bear has a healthy support wall at the 200-day SMA ($0.228). A further break will take the price down to the $0.2057 line.

%20%5B04.18.56,%2003%20Nov,%202020%5D-637399561759458634.png)
