- The Ripple price had a colossal 100% rally in the past three days, hitting $1.19.
- The digital asset encountered intense selling pressure as holders took profits.
- One key on-chain indicator shows that XRP is poised for a more substantial correction.
The Ripple price had one of the craziest rallies in the past three days, jumping by 100% to a three-year high of $1.19. Despite the ongoing SEC lawsuit against Ripple, XRP holders have grown confident in the digital asset and managed to push it above several important resistance levels.
Ripple price poised to fall deeper
On the 4-hour chart, XRP bulls fight to hold the 78.6% Fibonacci retracement level at $0.917. The digital asset faces massive profit-taking as several on-chain metrics indicate XRP is poised for a deeper correction.
%20%5B13.31.17,%2007%20Apr,%202021%5D-637533935180297768.png)
XRP MVRV (30d) and Active Addresses charts
The MVRV ratio (30D), a metric that shows the average profit or loss of XRP tokens moving in the past 30 days, has entered the danger zone above 40%, which is usually indicative of a significant upcoming correction.
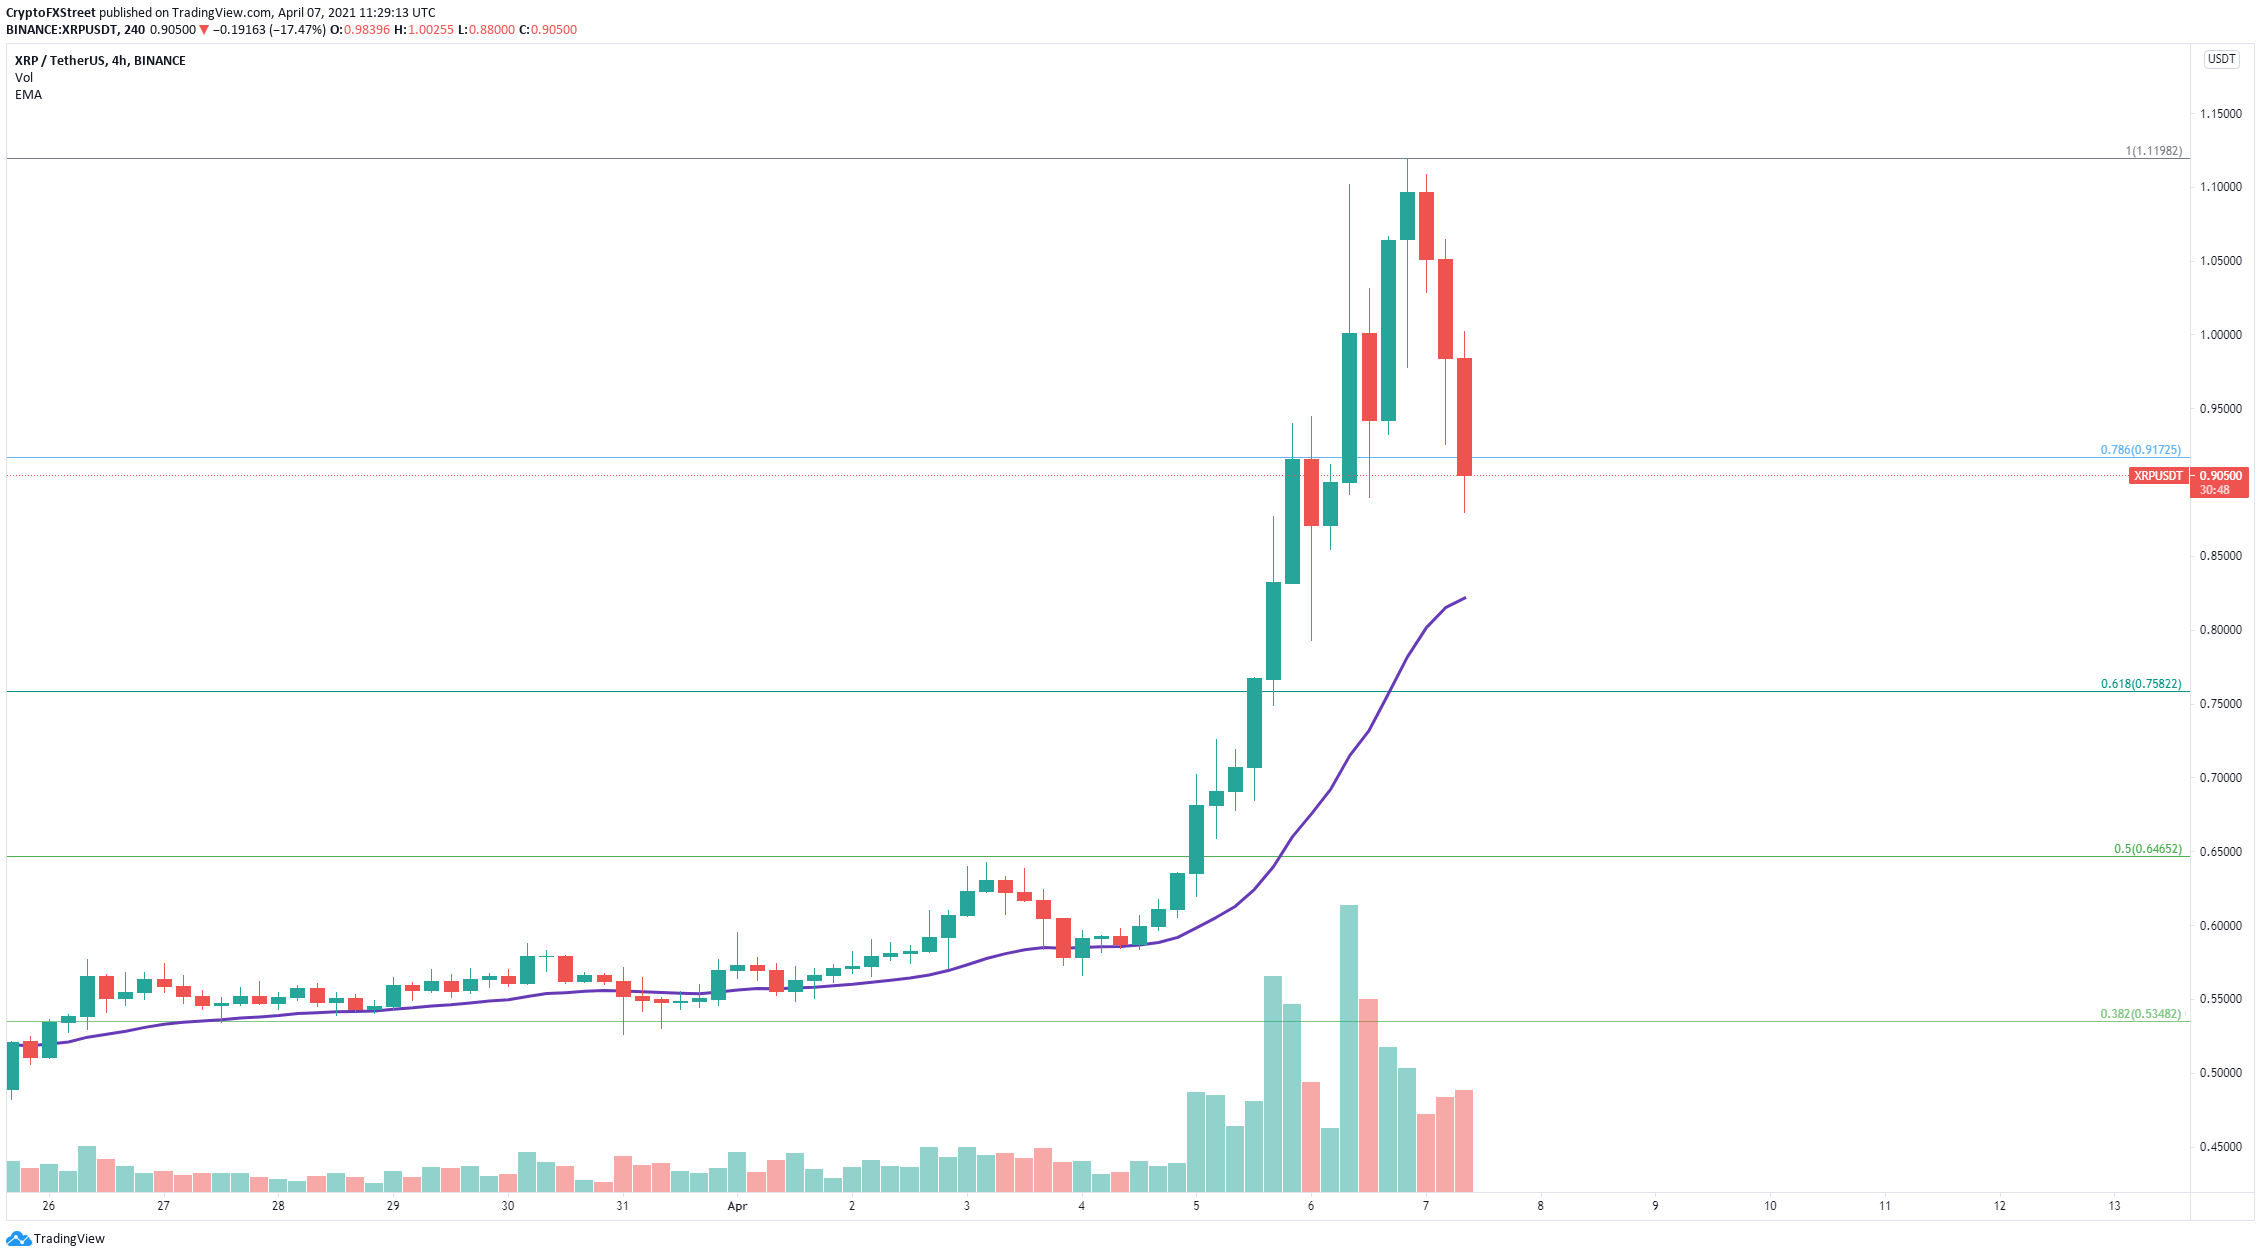
XRP/USD 4-hour chart
Additionally, the digital asset experienced a massive spike in the number of active addresses, which also happened on February 1 when XRP hit a peak of $0.72 before collapsing within the next 24 hours.
The next support level is the 26 EMA on the four-hour chart located at $0.824, followed by the 61.8% Fibonacci retracement point at $0.758.
Nonetheless, a rebound from the 78.6% Fibonacci level at $0.917 should drive the Ripple price toward the psychological level of $1 and as high as the previous peak of $1.19.
