- XRP/USD recovered above critical level of $0.01800.
- An important support is created by the intraday low.
Ripple (XRP) hit the low at $0.1785 on Thursday amid major sell-off across the cryptocurrency market; however, by the time of writing, the fourth-largest digital asset recovered to $0.1827. The coin has lost nearly 2% since this time on Wednesay, though it is still mostly unchanged since the beginning of the day.
XRP/USD 1-hour chart
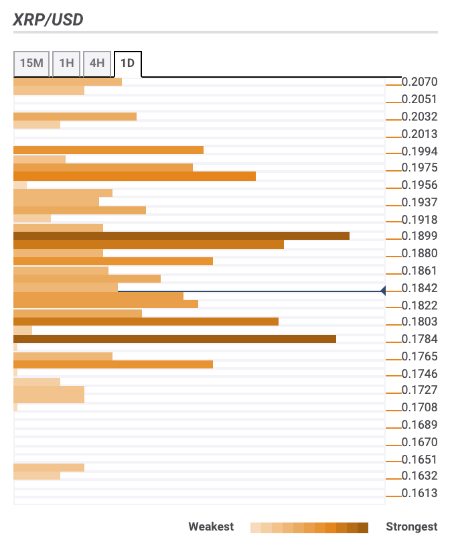
Ripple confluence levels
There are a lot of strong technical barriers clustered both above and below the current price, which means, XRP may continue moving ina range for the time being. Let’s have a closer look at the important support and resistance levels.
Resistance levels
$0.1900 – 23.6% Fibo retracement monthly and weekly, daily SMA10, 1-hour SMA200, 4-hour SMA50
$0.1960 – 4-hour SMA200, 161.9% Fibo Projection daily, Pivot Point 1-week Resistance 1
$0.2000 – the highest level of the previous week, daily SMA50.
Support levels
$0.1800 – Pivot Point 1-day Support 1, Pivot Point 1-week, Support 1,23.6% Fibo retracement monthly, the lower line of the 4-hour Bollinger Band
$0.1770 – the lowest level of the previous month
$0.1750 – the lowest level of the previous year
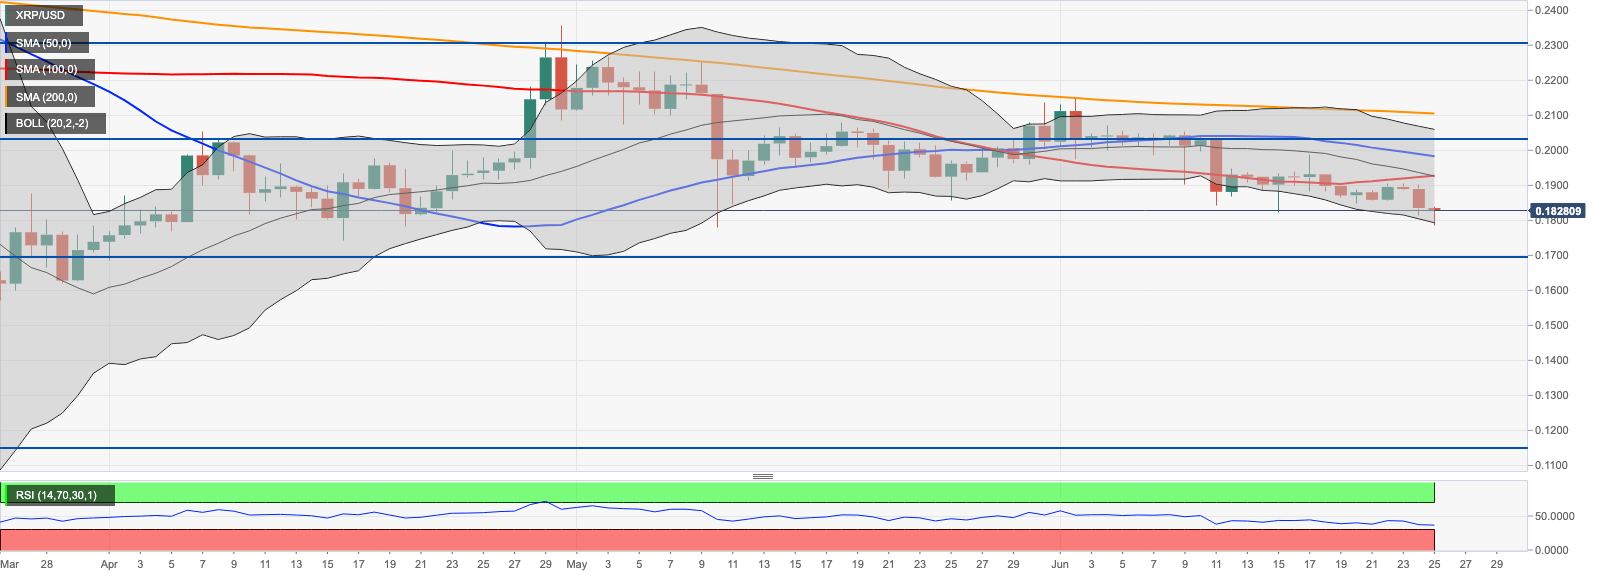
XRP/USD, 1-day