- Ripple price is bounded inside an ascending triangle on the 30-minutes chart.
- Several on-chain and technical indicators have turned bullish in favor of the digital asset.
XRP, like the rest of the market, had a significant crash from its peak of $0.78 down to $0.456. The digital asset is currently trying to bounce back up, awaiting a clear breakout or breakdown from an ascending triangle on the 30-minutes chart.
Ripple price aims for $0.7 as indicators turn bullish
On the 30-minutes chart, the MACD has just turned bullish as Ripple price bounces off the lower boundary of the ascending triangle pattern. The upper trendline of the pattern stands at $0.574, and it’s the most critical resistance level.
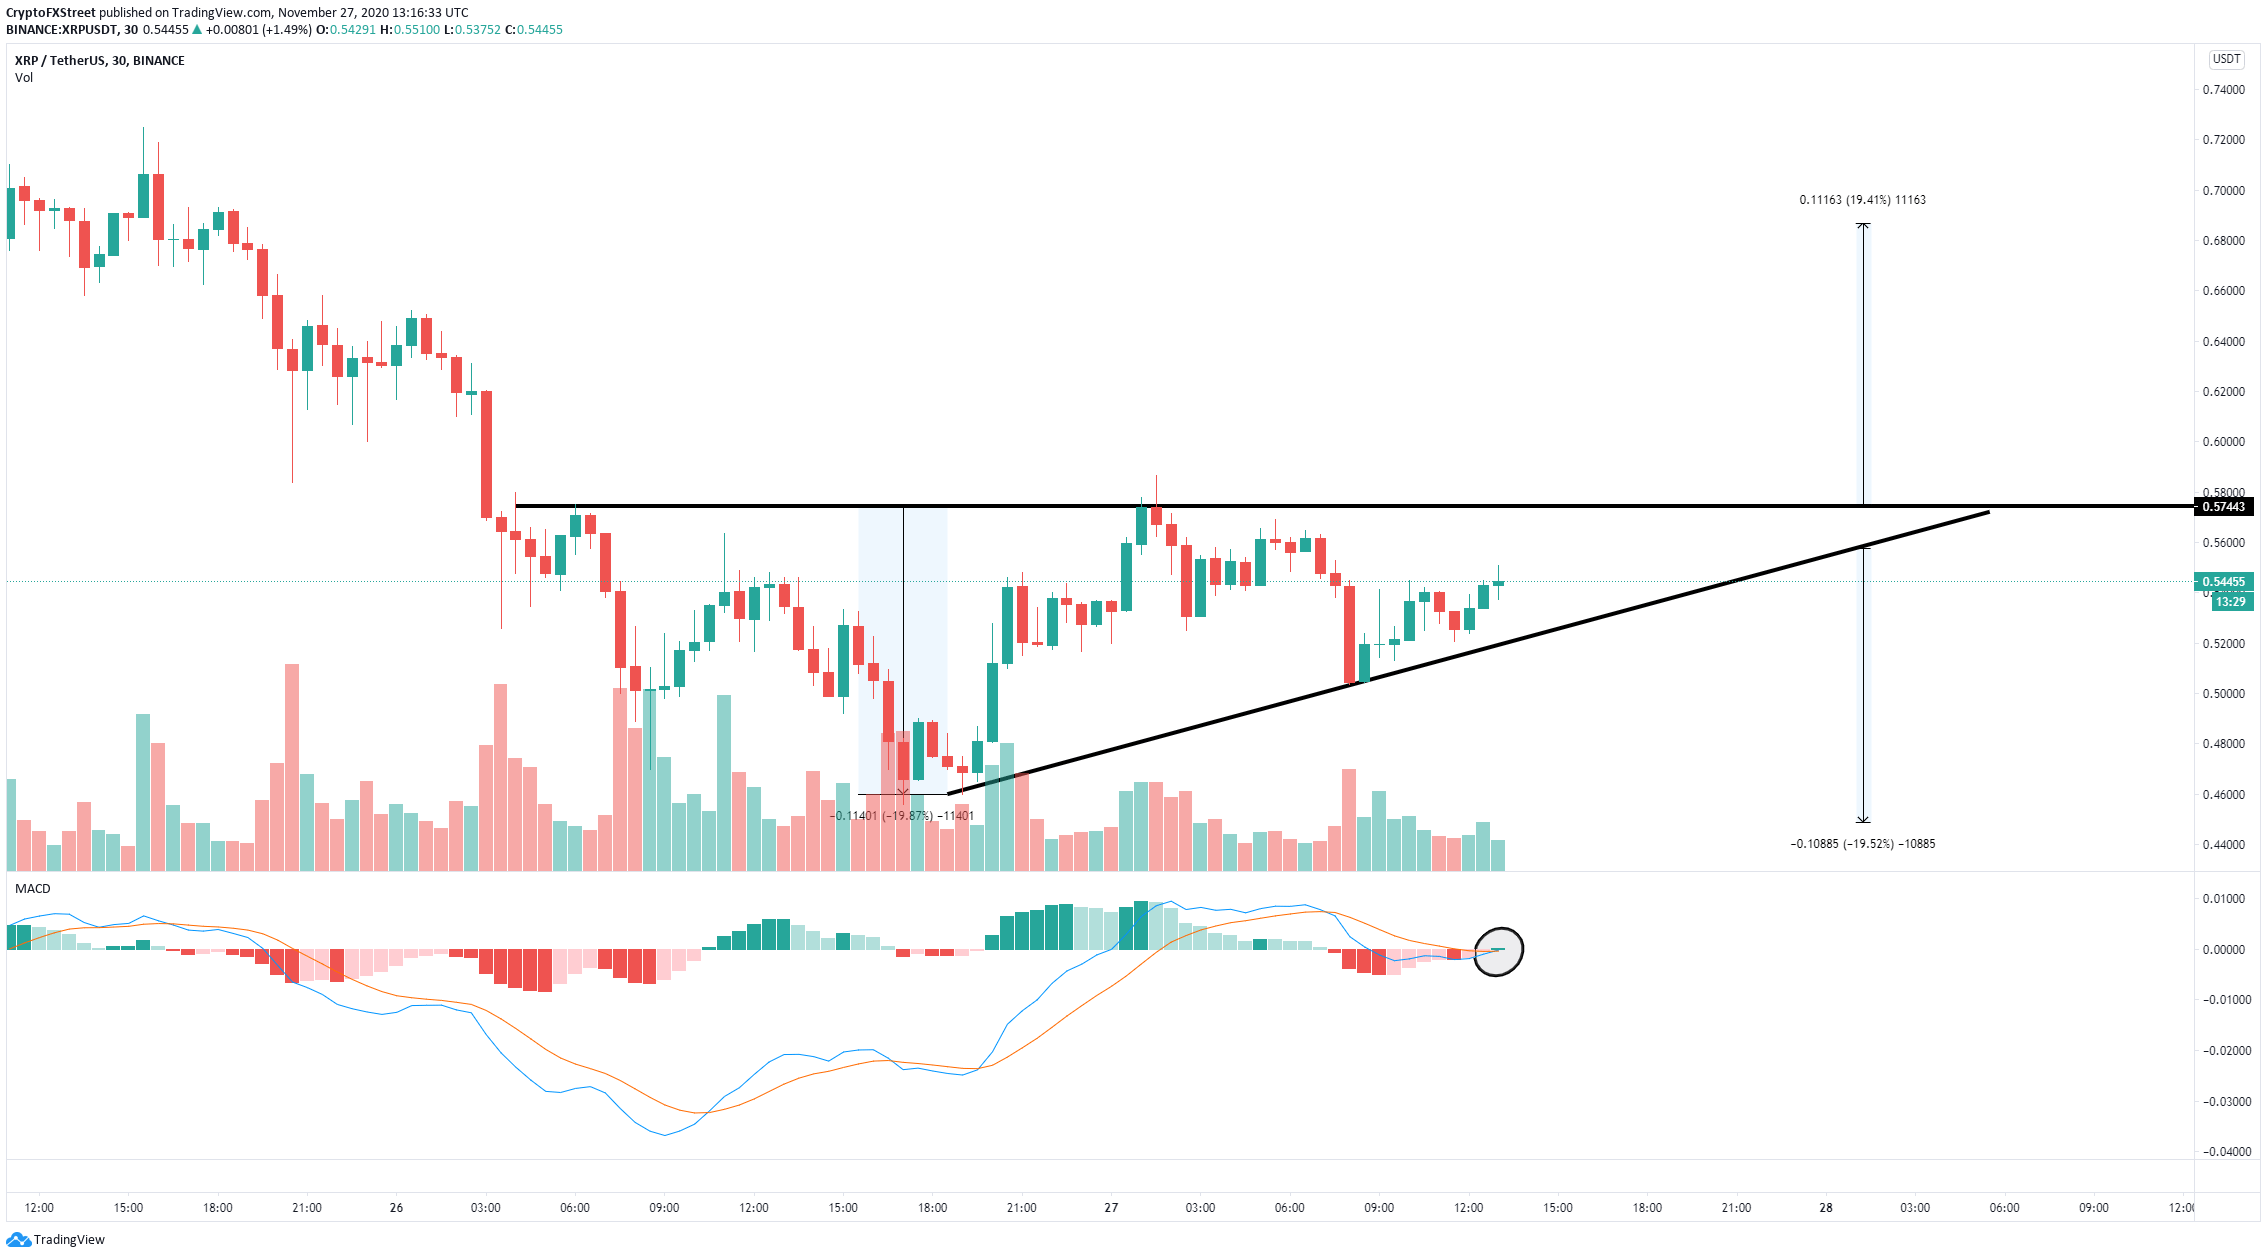
XRP/USD 30-minutes chart
It seems that the trading volume is declining slowly, which indicates a potential breakout is happening soon. Cracking the resistance level at $0.574 can quickly drive Ripple price towards $0.7.
%20%5B14.20.00,%2027%20Nov,%202020%5D-637420802387022288.png)
XRP Holders Distribution chart
Surprisingly, the number of whales holding 10,000,000 coins or more has been rising significantly during this correction, from 310 on November 22 to a high of 328 now, adding even more credence to the bullish outlook.
However, a breakdown below the lower boundary of the ascending triangle would be a notable bearish sign with the potential to push Ripple price towards $0.448, using the height of the pattern as a reference.
