- Ripple XRP price sustains the uptrend after gaining traction from last week’s support at $0.52.
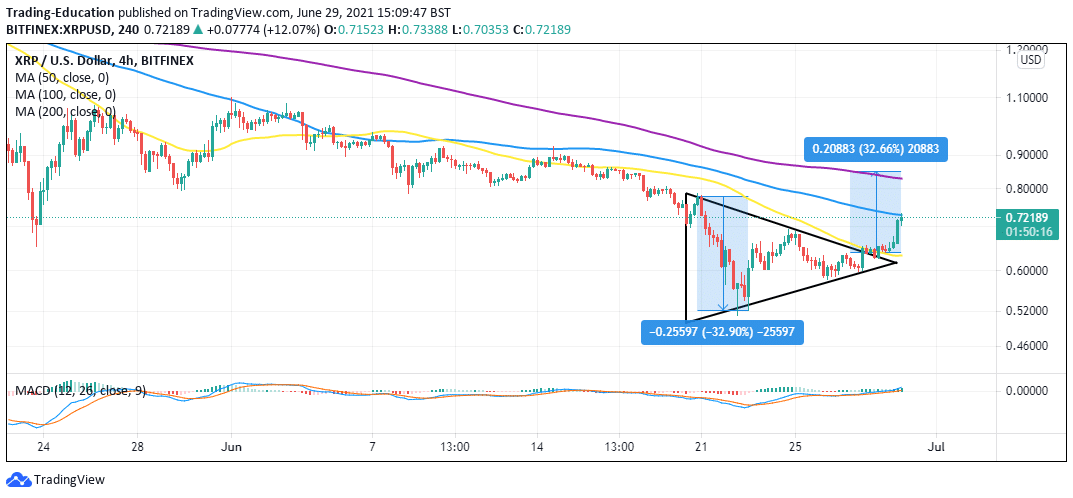
- XRP breaks out the symmetrical triangle on the 4-hour chart with a 32% target to $0.85.
Ripple XRP price began the ongoing recovery after diving to $0.52 at the beginning of last week. The support at this level allowed investors to raise their stakes at a lower price, thus pushing Ripple price above $0.6.
However, the recovery last week lost traction before the price hit $0.70, leading to another correction with losses revisiting $0.62. Over the weekend, XRP settled between $0.62 and $0.65; however, gains on Monday allowed bulls to focus on jumping above $0.7. Now those previously on the sidelines are returning to buy cryptocurrency.
Ripple XRP Price Symmetrical Triangle Breakout Underway
The four-hour chart reveals a symmetrical triangle, guiding traders to buy XRP into the anticipated recovery. This pattern is created using two trend lines, connecting a series of higher lows and lower highs.
A symmetrical triangle starts to form at its widest points, representing an increase in volume. As the pattern narrows, the volume reduces appreciably, and a consolidation period takes precedence. Note that a breakout is expected before the trend lines converge.
However, it is essential to realize that symmetrical triangles could lead to a bullish bias or a bearish bias. When the price breaks below the ascending trend line, it marks the beginning of a downtrend. On the other hand, cracking the descending trend line resistance paves the way for an uptrend.
For example, Ripple is in the course of a 32% breakout that may see it rise to $0.85. Triangles have exact breakout targets equal to the distance between the patterns’ highest to lowest points. Hence, the potential 32% XRP upswing to $0.85.
XRP/USD 4-hour chart flips massively bullish
The same four-hour chart hints at the sustainable uptrend based on the Moving Average Convergence Divergence (MACD) indicator. This is a trend-following tool that also calculates the asset’s momentum.
As Ripple price stabilizes above $0.7, the uptrend to $0.85 is bound to continue in the short-term as the MACD crossed the zero line into the positive region. Another bullish signal occurred when the MACD line (blue) crosses above the signal line.
Meanwhile, the 100 Simple Moving Average (SMA) limits Ripple price immediate upside. A four-hour close above this level is required to validate the uptrend. Note that jumping above $0.8 could trigger massive buy signals as investors rush to speculate gains above $1.
It is worth mentioning that a correction may ensue if Ripple fails to break the 50 SMA and loses support at $0.7. With an overhead pressure surge, Ripple price will likely explore lower levels at $0.6 and $0.5, respectively.
Looking to buy or trade Ripple (XRP) now? Invest at eToro!
Capital at risk