- XRP/USD are in control as the price drifts to $0.2700.
- The coin needs to regain ground above $0.2800.
Ripple’s XRP has been drifting down towards the support area at $0.2700 since the beginning of the week. The coin touched $0.2893 low on Monday, though a host of stop orders located around $0.2700 stopped the sell-off and pushed the price to $0.2730. XRp/USD has stayed mostly unchanged both on a day-to-day basis and since the beginning of Monday.
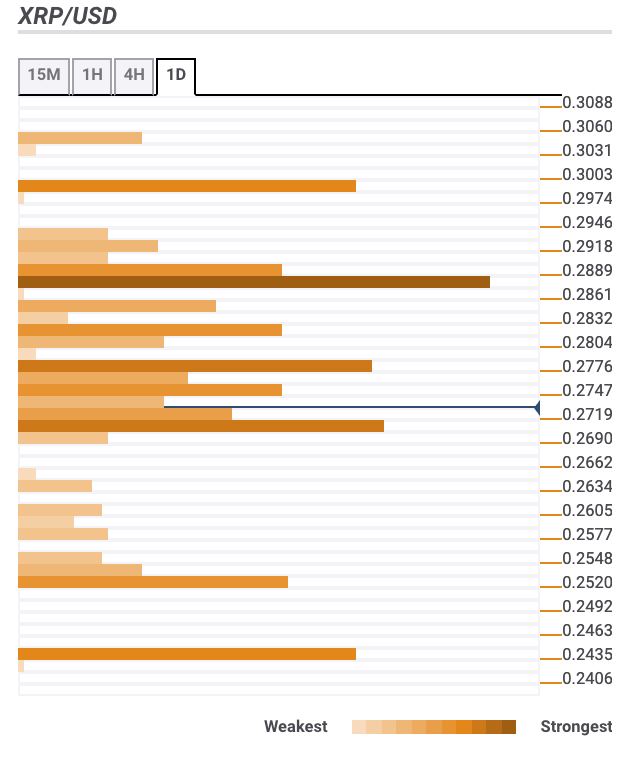
Ripple’s XRP confluence levels
Looking technically, $0.27 is now the key support level for XRP/USD. As long as it stays intact, the coin has a chance to develop a recovery; though, in the short-run, the upside momentum may be capped by $0.2800. Let’s have a closer look at them.
Resistance levels
$0.2770 – SMA100 (Simple Moving Average) on 1-hour, and daily charts SMA50 daily, 61.8% Fibo retracement daily, the middle line of 4-hour Bollinger Band
$0.2870 – SMA200 1-hour, 38.2% Fibo retracement weekly, Pivot point 1-day, Resistance 2
$0.3000 – 23.6% Fibo retracement monthly, 61.8% Fibo retracement weekly
Support levels
$0.2700 – 61.8$ Fibo retracement monthly, the lower line of the daily Bollinger Band, the lowest level of the previous day.
$0.2520 – the lowest level of the previous year
$0.2430 – the lowest level of the previous month, Pivot Point 1-week Support 2

