- XRP/USD bulls has been mired in a range under $0.2800.
- The coin may extend the downside correction to $0.2700.
Ripple’s XRP hit $0.2752 during early Asian hours, however, the upside proved to be short-lived. By the time of writing, XRP/USD resumed the decline and returned to $0.2730. The coin has been moving inside the range limited by $0.2700 on the downside and $0.2800 on the upside since the beginning of the week.
Ripple’s XRP confluence levels
Looking technically, $0.27 remains now the key support for XRP/USD. As long as it stays intact, the coin has a chance to resume an upside recovery; though, in the short-run, the upside momentum may be capped by $0.2800. Let’s have a closer look at the technical levels that may serve as resistance and support areas for the coin.
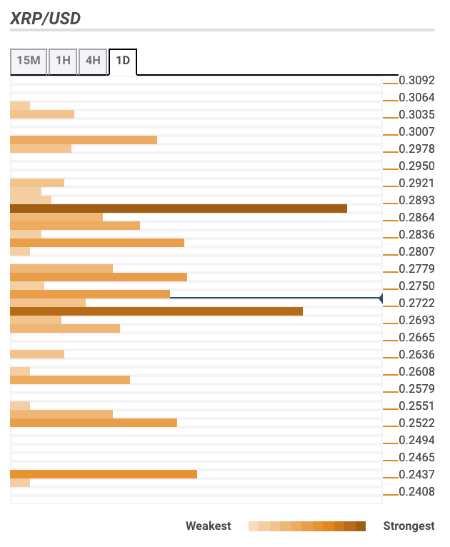
Resistance levels
$0.2770 – SMA100 (Simple Moving Average) on 1-hour, and daily charts SMA50 daily, 61.8% Fibo retracement daily, the middle line of 4-hour Bollinger Band
$0.2820 – 23.6% Fibo retracement weekly, 161.8% Fibo projection daily
$0.2900 – 38.2% Fibo retracement monthly and weekly
Support levels
$0.2700 – 23.6% Fibo retracement daily, 38.2% Fibo retracement daily, 61.8$ Fibo retracement monthly, the lower line of the daily Bollinger Band, the lowest level of the previous 4-hour interval
$0.2600 – Pivot Point 1-day Support 3, Pivot Point 1-week Support 1
$0.2430 – the lowest level of the previous month, Pivot Point 1-week Support 2