- XRP/USD recovered above critical level of $0.01900.
- An important support is created by Thursday’s low.
Ripple (XRP) hit the low at $0.1843 on Thursday amid major sell-off on the cryptocurrency market; however, by the time of writing, the fourth-largest digital asset recovered above $0.1930. The coin has gained over 3% since the start of the day, though it is stil in the red zone on a day-to-day basis.
XRP/USD 1-hour chart
-637275591344666566.png)
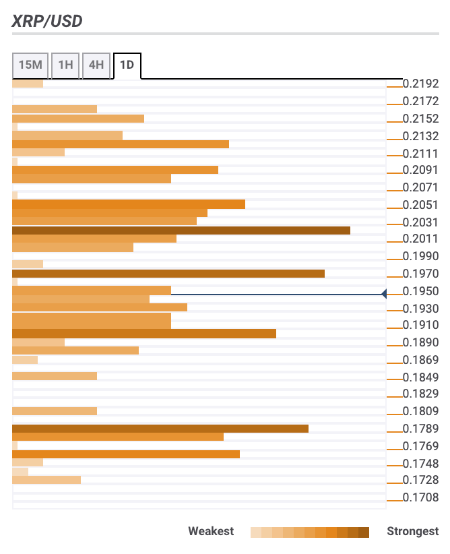
Ripple confluence levels
There are a lot of strong technical barriers clustered both above and below the current price, which means, XRP may continue moving ina range for the time being. Let’s have a closer look at the important support and resistance levels.
Resistance levels
$0.1970 – 38.2% Fibo retracement monthly, 61.8% Fibo retracement daily, 4-hour SMA10
$0.2030 – 1-hour SMA200, 4-hour SMA50 and SMA100, 23.6% Fibo retracement weekly
$0.2100 – 61.8% Fibo retracement monthly, the upper line of the 4-hour Bollinger Band
Support levels
$0.1900 – 23.6% Fibo retracement monthly, the lower line of the 4-hour Bollinger Band
$0.1840 – the lowest level of the previous day
$0.1800 – Pivot Point 1-month Support 1, the lowest level of the previous month
XRP/USD, 1-day