- XRP/USD is bought at $0.2000, which is a positive signal.
- The local resistance is created on approach to $0.2100.
XRP/USD is changing hands at $0.2040, off the intraday low at $0.1999. The coin has barely changed both on a day-to-day basis and since the start of the day. The buying interest located on the approach to $0.2000 helps to limit the decline, which is a positive signal for the coin from the short-term perspective. The local resistance is created by the upper line of the 1-hour Bollinger Band at $0.2050 and Wednesday’s high at $0.2077. Once this area is cleared, the coin may retest the psychological $0.2100
Ripple’s XRP takes fourth place in the global cryptocurrency rating with the total market value of $8.9 billion. It has been changing places with Tether (USDT) recently; the stablecoin now has the market value of $9.1 billion.
XRP/USD 1-hour chart
-637268707736052906.png)
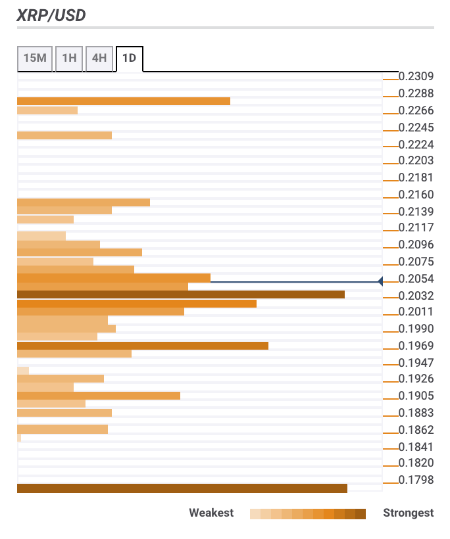
Now let’s have a closer look at the support and resistance levels to found out what to expect from XRP in the nearest future.
Resistance levels
$0.2090-$0.2100 – 61.8% Fibo retracement monthly, Pivot Point 1-day Resistance 3
$0.2150 – 161.8% Fibo projection weekly, daily SMA200
$0.2270 – Pivot Point 1-month Resistance 1, the highest level of the previous month
Support levels
$0.2030 – 1-hour SMA200, 4-hour SMA50, 38.2% Fibo retracement daily, 61.8% Fibo retracement daily
$0.2000 – 4-hour SMA100, the middle line of the daily Bollinger Band
$0.1960 – daily SMA100, 38.2% Fibo retracement monthly.