- Ripple price has been stuck in indecision since the Tuesday September 07 cryptocurrency market flash crash.
- XRP may make a big move to the upside as the price volatility decreases.
- The measured target of the symmetrical triangle suggests thar Ripple may make a 28% upswing, but several hurdles may curtain the rally.
The short-term XRP price prediction is neutral as it trades at $1.0905 amidst consolidation. The horizontal price action shows that Ripple price is stuck in indecision. However, a crucial technical pattern shows that the international payments token could be headed for 28% upswing. But multiple hurdles could hamper Ripple’s bullish target. Similarly, Ripple could find substantial support downwards should the bullish outlook be invalidated.
Ripple Price Chart Pattern Aims For $1.40
Ripple price has spelt out a symmetrical triangle pattern on the four-hour chart, indicating that the bullish and bearish pressures are generally cancelling out. The horizontal price action points to decreasing price volatility hinting at a possible breakout in either direction in the near term. This is validated by the narrowing of the Bollinger Bands (BB). Note that as the Bollinger Bands squeeze towards each other, the indecision nears an end as XRP waits for the big move.
The horizontal movement of the Moving Average Convergence Divergence (MACD) indicator close to the neutral line and the Position of the Relative Strength Index (RSI) indicator at 49.2 add credence to Ripple’s market indecision.
The measured target of the symmetrical triangle is either a 28% climb to $1.40 or a 28% decline to $0.781.
Should XRP price favour the bulls and break out above the upper trend line of the symmetrical triangle (resistance line), the odds of Ripple moving upwards to hit the 28% upswing to $1.40 will be increased.
However, before the cross-border remittances token reaches this target, it has to overcome a number of obstacles along the way.
The first hurdle is at $1.095, where the 50 period Simple Moving Averages (SMA) is sitting. The second and the third hurdles are at $1.167 and $1.178 where the 100 and 200 SMA are respectively. The fourth resistance is provided by the $1.211 major resistance level. The last resistance is the $1.30 psychological level which coincides with the upper tip of the governing chart pattern.
- Read this guide If you wish to trade Ripple using crypto robots.
XRP/USD Four-Hour Chart
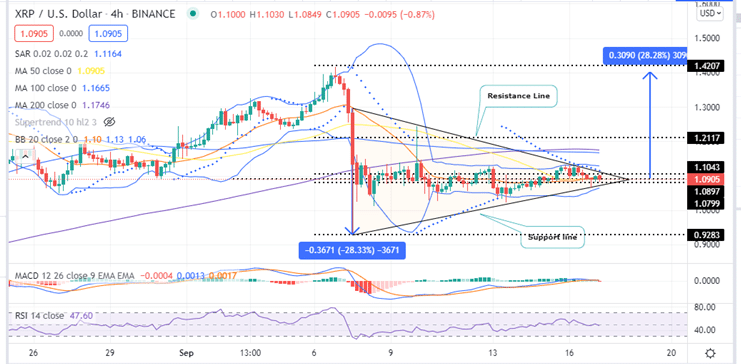
On the flipside, should Ripple price favour the bulls, it could decline 28% plunging to $0.781. Before, XRP hits this bearish target, the altcoin may find support around the $1.07 at the lower boundary of the symmetrical triangle.
Further support areas may emerge around the $1.051 major support where Ripple found formidable support in the past. A further drop below this level could see XRP tank to revisit the $1.025 and the $0.95 support levels.
Looking to buy or trade Ripple now? Invest at eToro!
Capital at risk
