- Ripple price prediction is bearish as indicated by the descending parallel channel.
- XRP bulls must hold on to the crucial support at $1.080 if they are to see any recovery.
- Sustained recovery might see Ripple rally 16% upwards.
Ripple price has had four straight bearish four-hour sessions at the beginning of the trading day on Thursday. Bulls attempted to reverse the correction during the fifth session but their efforts to lift XRP from an intra-day low at $1.0646 were met by immense resistance from the $1.0908 resistance level.
The price of the cross-border remittances token ended the day trading in red at $1.0717 after reaching an intra-day high of around $1.1865, coinciding with the upper boundary of the descending parallel channel. XRP started the day on Friday trading in the green has and has displayed straight bullish sessions so far rising 5% to the current price at $1.1266.
Ripple Price May Drop To Below $1.080 Level
The short-term XRP price prediction bearish as validated by the technical indicators. A look at the chart shows that an extended bearish leg could take the Ripple price below the $1.080 crucial support level.
Considering that Ripple bulls unsuccessfully defended the $1.080 support area 10 times since August 14, it is likely the international remittances coin will revisit areas below this level. If this happens, it will extend XRP towards the $1.0 psychological level embraced by the lower boundary of the descending parallel channel as seen on the four-hour chart.
This bearish outlook is validated by the movement of the Moving Averages Convergence Divergence (MACD) indicator line (blue) below the signal line (orange). Moreover, the position of the MACD below the neutral line in the negative region points to a bearish momentum.
XRP/USD Four-Hour Chart
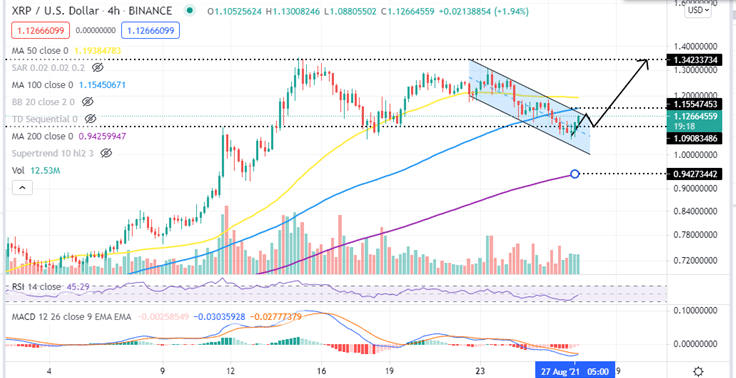
Note that bears might find it difficult to push the Ripple price lower than the $1.0 mark embraced by the lower tip of the descending parallel channel, making it possible for XRP to recover. The possibility of a trend reversal is accentuated by the Relative Strength Index which upsloping away from the oversold zone. This means that are tiring out as bulls to take control of the market.
- If you are looking for crypto signals to know where to buy Ripple, our detailed guide will be useful.
Moreover, bullish outlook will be confirmed when the MACD indicator sends a call-to-buy signal in the near-term. This will happen when the blue MACD line (the 12-day Exponential Moving Average (EMA)) crosses above the orange signal line (26-day SMA). If this happens, it will trigger sell orders that would likely lift the Ripple price way from the $1.080 support wall.
A decisive bullish break-out will happen if Ripple closes the day above the 100-day Simple Moving Average (SMA) at $1.1554 breaking out above the upper boundary of the descending channel. If this happens, XRP could rise to test re-test the $1.30 psychological level, representing a 16% rise from the current price. Note that Ripple might take a breather around the 50-day SMA at $1.20 before reaching $1.30.
Where To Buy XRP Now?
The top exchanges for trading in Ripple cheap currently are: eToro, FTX, Binance and Coinbase. You can find others listed on our crypto trading platforms page.
Looking to buy or trade Ripple now? Invest at eToro!
Capital at risk
