- XRP/USD returns to the red as bias turns bearish in the near-term.
- Rising wedge breakdown confirmed on the hourly chart.
- Bulls still insist amid falling channel breakout on daily sticks.
Ripple (XRP/USD) appears to have faded its five-day winning momentum this Sunday, as the bulls are giving into the bears’ fighting spirit.
XRP/USD: Hourly chart
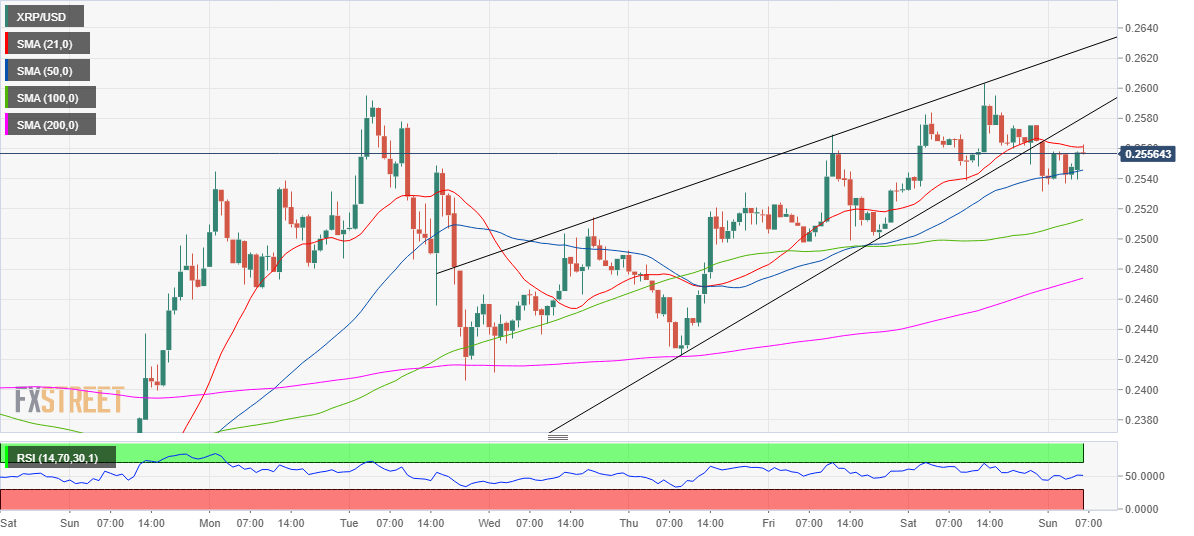
A rising wedge breakdown confirmed on the hourly chart early Sunday, suggests more room to the downside. The price has managed to hold onto the 50-hourly moving average (HMA) at 0.2544 following a breach of the 0.2564 pattern support. The next support line awaits at the 100-HMA at 0.2512.
Any rebound is likely to be tested by the bearish 21-HMA at 0.2561, above which the 0.2580 level, the previous rising trendline support now resistance, will come into play. The hourly Relative Strength Index (RSI) has turned flat at the midline, suggesting a lack of clear direction, at the moment.
XRP/USD: Daily chart
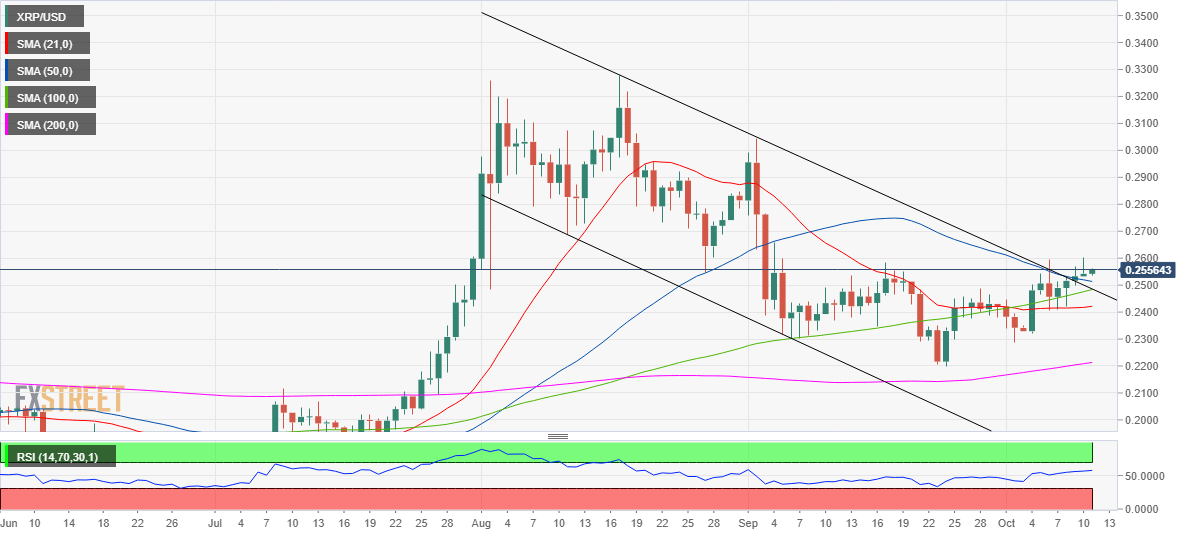
Despite a somewhat bearish picture panted by the one-hour chart, the broader picture continues to favor the bulls, as depicted on the daily chart.
The spot confirmed a falling channel breakout on Friday while the 14-day RSI point higher in the bullish region. The price has recaptured all of the key daily moving averages (DMAs), further boosting the odds for additional gains in the week ahead.
The immediate cushion remains the 50-DMA at 0.2513 while the buyers gear up to conquer 0.3000 levels once again.
XRP/USD: Additional levels to consider
