Home Ripple Technical Analysis: XRP/USD crashes lower, but takes a quick time out, before the bears reapply intensifying pressure
Crypto News

Ripple Technical Analysis: XRP/USD crashes lower, but takes a quick time out, before the bears reapply intensifying pressure

  • Ripple price was seen down a chunky 5% on Tuesday, as the firm pressure from the bears intensifies.  
  • XRP/USD crashed down below $0.25, where a demand zone kicked into play.
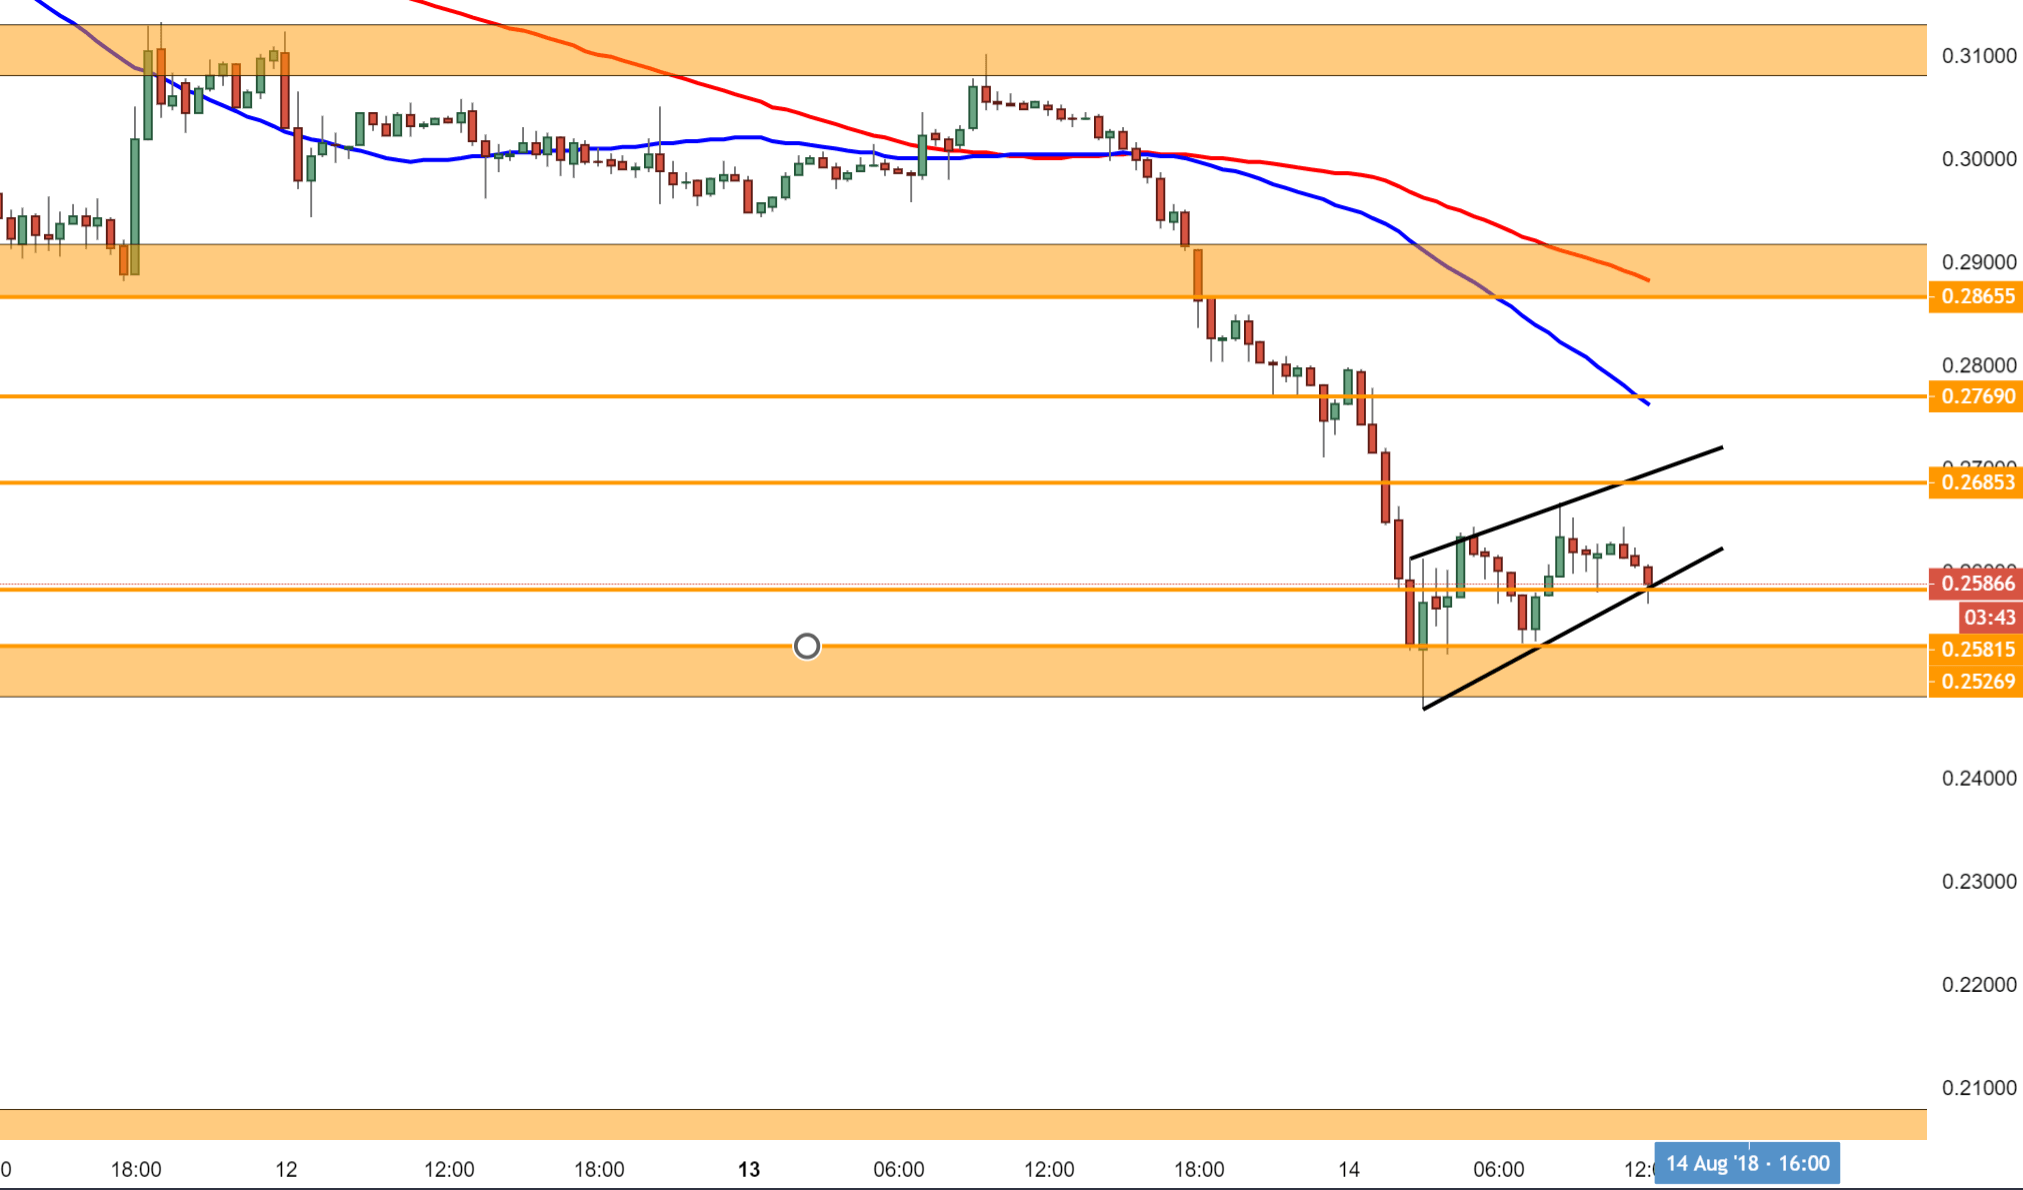
  • Price action has formed a rising wedge pattern, which looks worrying, demonstrating another breakout south is potentially pending.  


XRP/USD 30-minute chart


Spot rate:                    0.25889

Relative change:        -5.57%

High:                           0.27756

Low:                            0.24653

Trend:                         Bearish


Support 1:                        0.25815, lower part of rising wedge.

Support 2:                        0.25269, (support on 30-minute chart).

Support 3:                        0.24653, today’s (Tuesday) low.

Resistance 1:              0.26853, upper part of rising wedge.

Resistance 2:             0.27690, 50MA.

Resistance 3:             0.28655, supply zone & 100MA area.


FX Street

FX Street

FXStreet is the leading independent portal dedicated to the Foreign Exchange (Forex) market. It was launched in 2000 and the portal has always been proud of their unyielding commitment to provide objective and unbiased information, to enable their users to take better and more confident decisions.