- XRP/USD sees a pullback towards broken pennant structure, completing a breakout and retest.
- 60-minute chart view shows price is still very much supported for further upside.
XRP was seen nursing chunky losses towards the latter stages of trading on Friday, down some 4.5%, as the price further cools. The upside momentum has failed to be sustained after the run into resistance heading towards $0.4100.
XRP/USD 4-hour chart
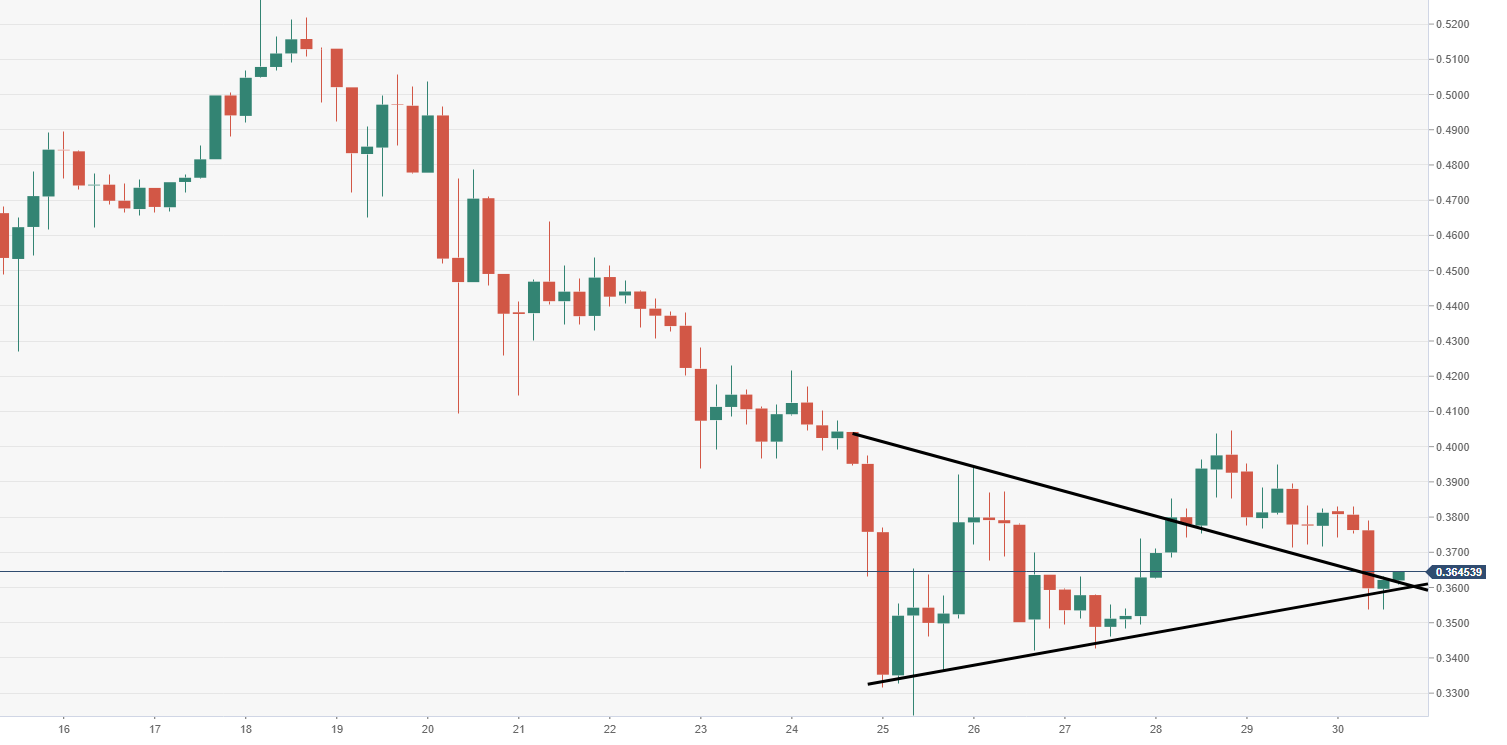
The latest rebound that commenced on 27th November, the bulls push for a breakout from a pennant pattern structure. This can be seen via the 4-hour chart view. Over the past two days now, the price has retested that breached formation, leaving room for this to be capitalized on.
60-minute chart
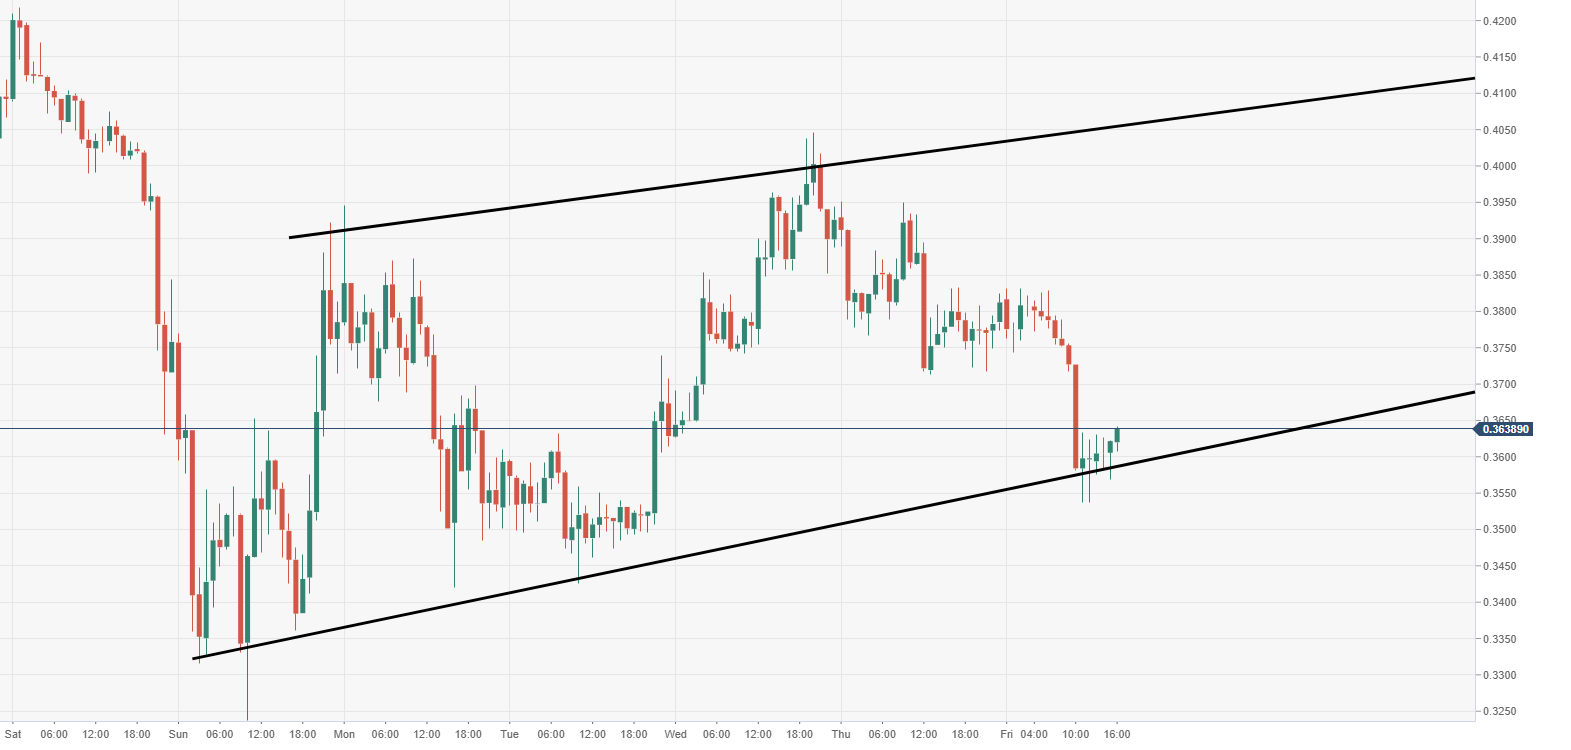
Looking via the 60-minute chart view, price action has been moving within an ascending channel formation. The price was caught by the lower trend line, from free-falling deep to the south. Support looks sturdy around the $0.3500 territory. Major resistance and barrier remains at $0.4100 for the bulls to try and tackle.
