- Ripple’s XRP price on Monday trading up with minor gains of 1.5% in the early part of the session.
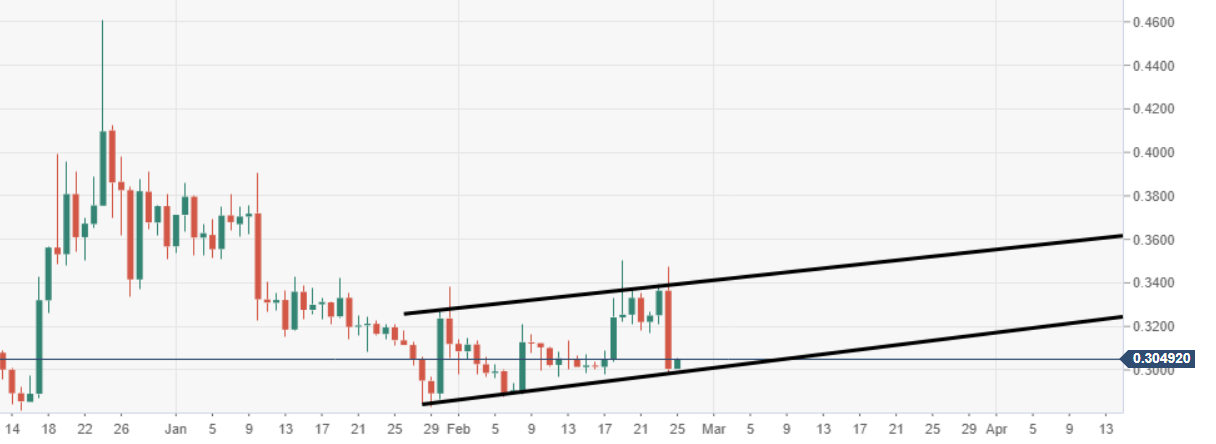
- XRP/USD price action is moving within a bearish flag/ ascending channel formation.
Spot rate: 0.3048
Relative change: +1.50%
High: 0.3054
Low: 0.3003
Trend: Bullish
Trends:
Daily SMA20: 0.3102
Daily SMA50: 0.3189
Daily SMA100: 0.3432
Daily SMA200: 0.3776
Levels:
Previous Daily High: 0.3473
Previous Daily Low: 0.2983
Previous Weekly High: 0.3505
Previous Weekly Low: 0.2982
Previous Monthly High: 0.3906
Previous Monthly Low: 0.2833
Daily Fibonacci 38.2%: 0.317
Daily Fibonacci 61.8%: 0.3286
Daily Pivot Point S1: 0.2834
Daily Pivot Point S2: 0.2663
Daily Pivot Point S3: 0.2343
Daily Pivot Point R1: 0.3325
Daily Pivot Point R2: 0.3644
Daily Pivot Point R3: 0.3815
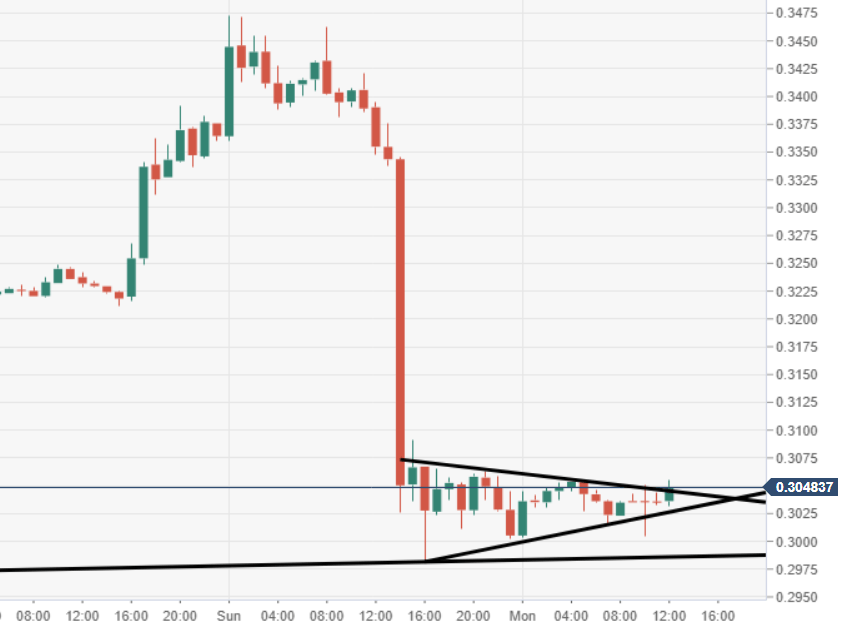
XRP/USD 60-minute chart
- Possible near-term bearish pennant formation eyed via the 60-minute view.
XRP/USD daily chart
- Price moving within a bearish flag/ascending channel formation via the daily.