- Ripple’s XRP price on Tuesday nursing steep losses of around 3% in the second half of the session.
- XRP/USD bulls do not seem to have enough momentum to breakdown $0.3500-0.3600.
XRP/USD 15-minute chart
- Near-term ascending trend line via the 15-minute providing some minor comfort.
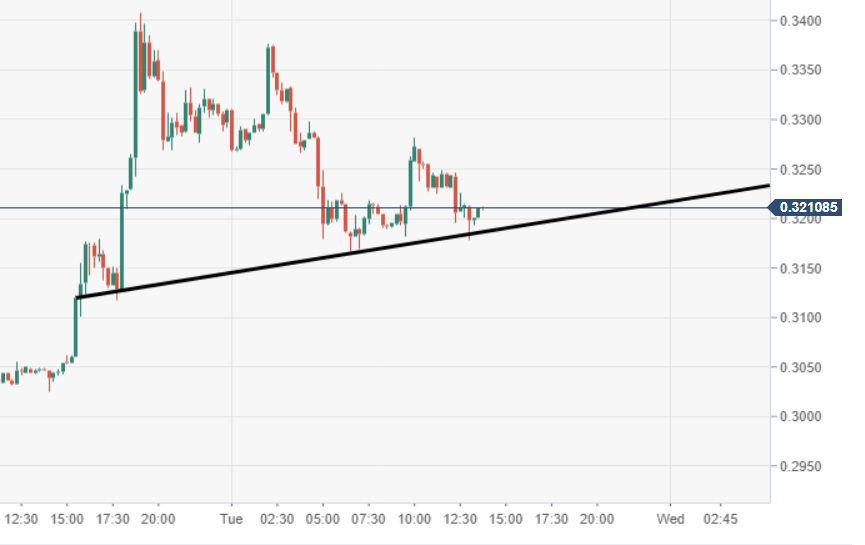
Spot rate: 0.3211
Relative change: -3.01%
High: 0.3375
Low: 0.3166
Trend: Bearish
Trends:
Daily SMA20: 0.3118
Daily SMA50: 0.3182
Daily SMA100: 0.3417
Daily SMA200: 0.3776
Levels:
Previous Daily High: 0.3408
Previous Daily Low: 0.3004
Previous Weekly High: 0.3505
Previous Weekly Low: 0.2982
Previous Monthly High: 0.3906
Previous Monthly Low: 0.2833
Daily Fibonacci 38.2%: 0.3254
Daily Fibonacci 61.8%: 0.3158
Daily Pivot Point S1: 0.3073
Daily Pivot Point S2: 0.2836
Daily Pivot Point S3: 0.2668
Daily Pivot Point R1: 0.3477
Daily Pivot Point R2: 0.3645
Daily Pivot Point R3: 0.3882
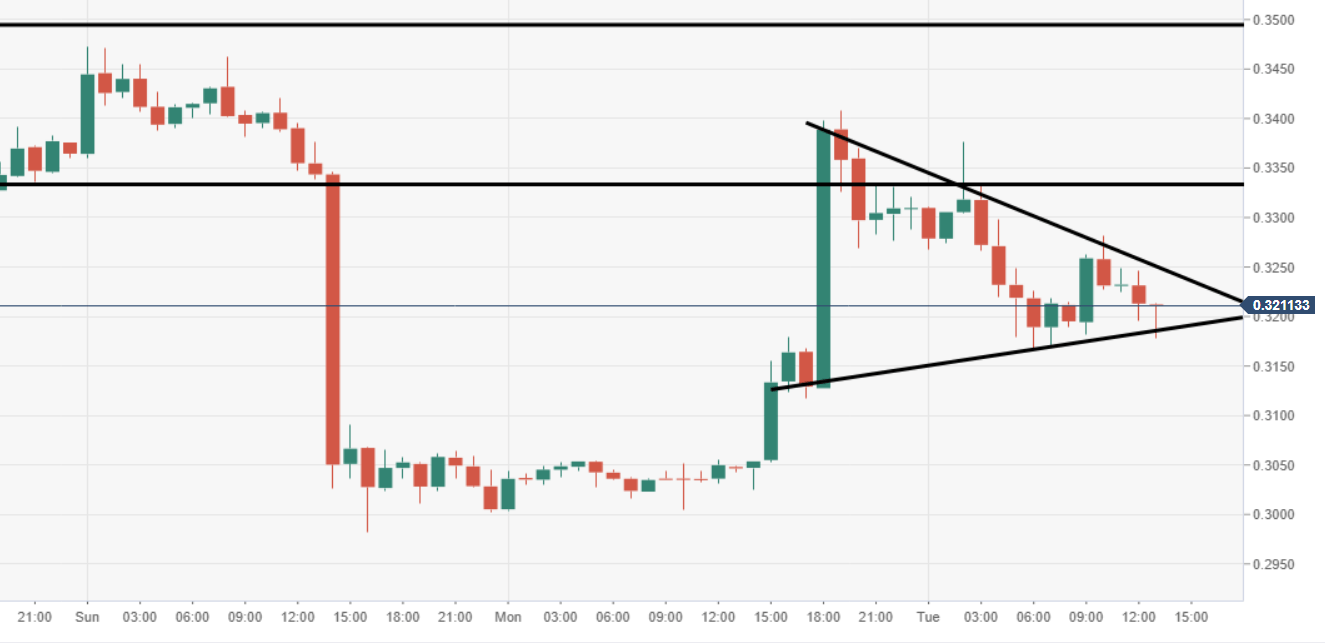
XRP/USD 60-minute chart
- Price moving within a pennant/triangular structure, immediate support at $0.3180, resistance at $0.3280, the respective lower and upper trend lines.
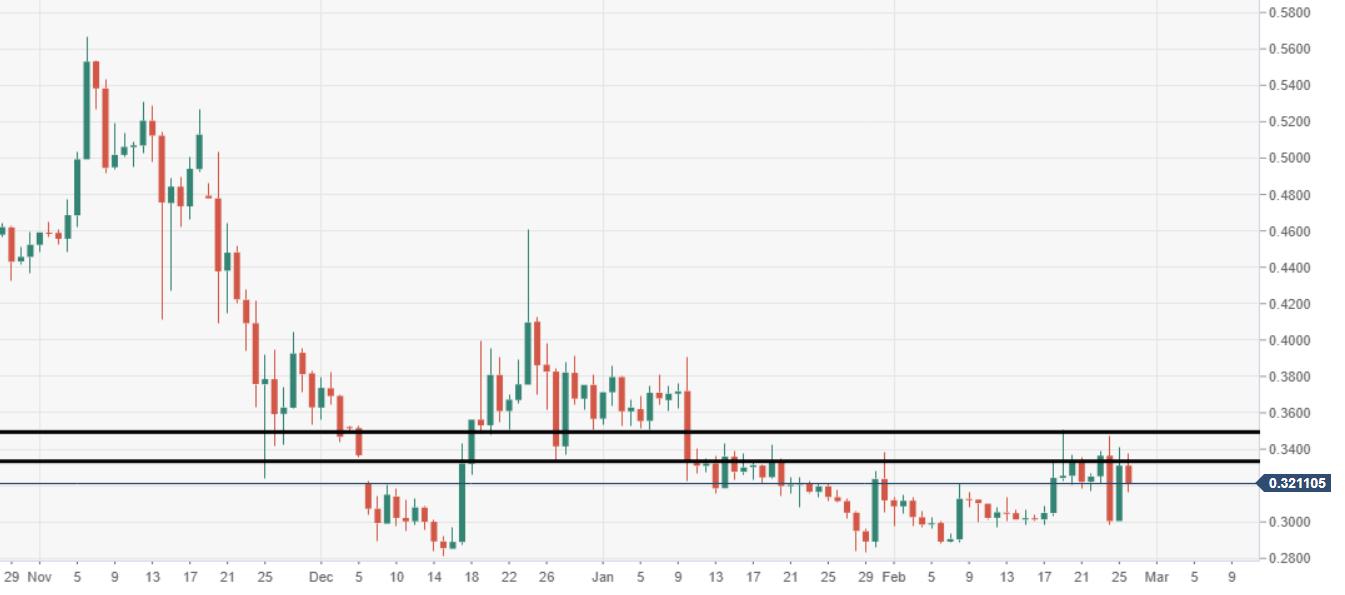
XRP/USD daily chart
- Bulls continue to struggle breakdown the tough stubborn barrier at $0.3500-0.3600 price range.