- Ripple’s price on Friday is trading up in marginal positive territory, holding minor gains of just some 0.40%.
- XRP/USD moving within a range-block formation, as seen across the market with some of its peers.
XRP/USD 15-minute chart
- As can be clearly highlighted on the 15-minute view, an ascending channel formation. When viewed on via the 60-minute chart, looks to be a bearish flag.
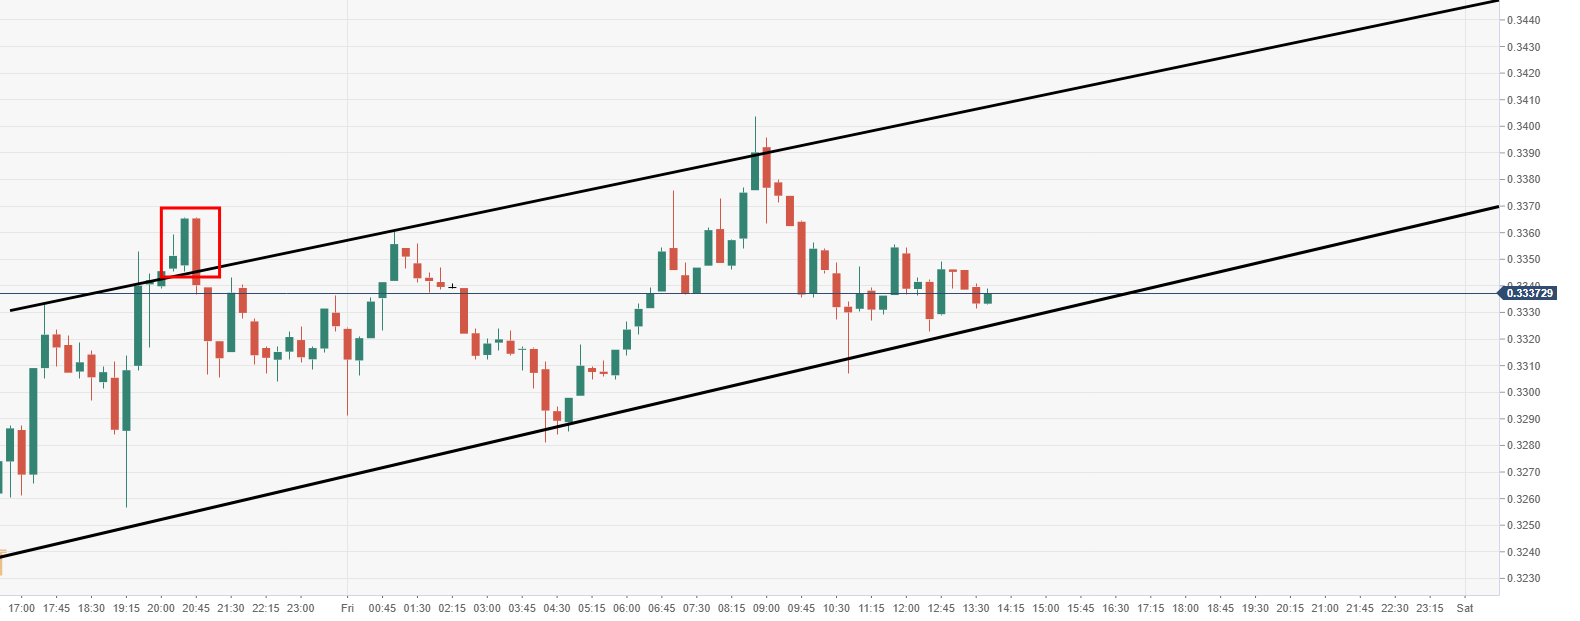
Spot rate: 0.3905
Relative change: +0.38%
High: 0.3403
Low: 0.3281
Trend: Bearish
Support 1: 0.3064, daily pivot point support.
Support 2: 0.2803, daily pivot point support.
Support 3: 0.2382, daily pivot point support.
Resistance 1: 0.3746, daily pivot point resistance.
Resistance 2: 0.4167, daily pivot point resistance.
Resistance 3: 0.4428, daily pivot point resistance.
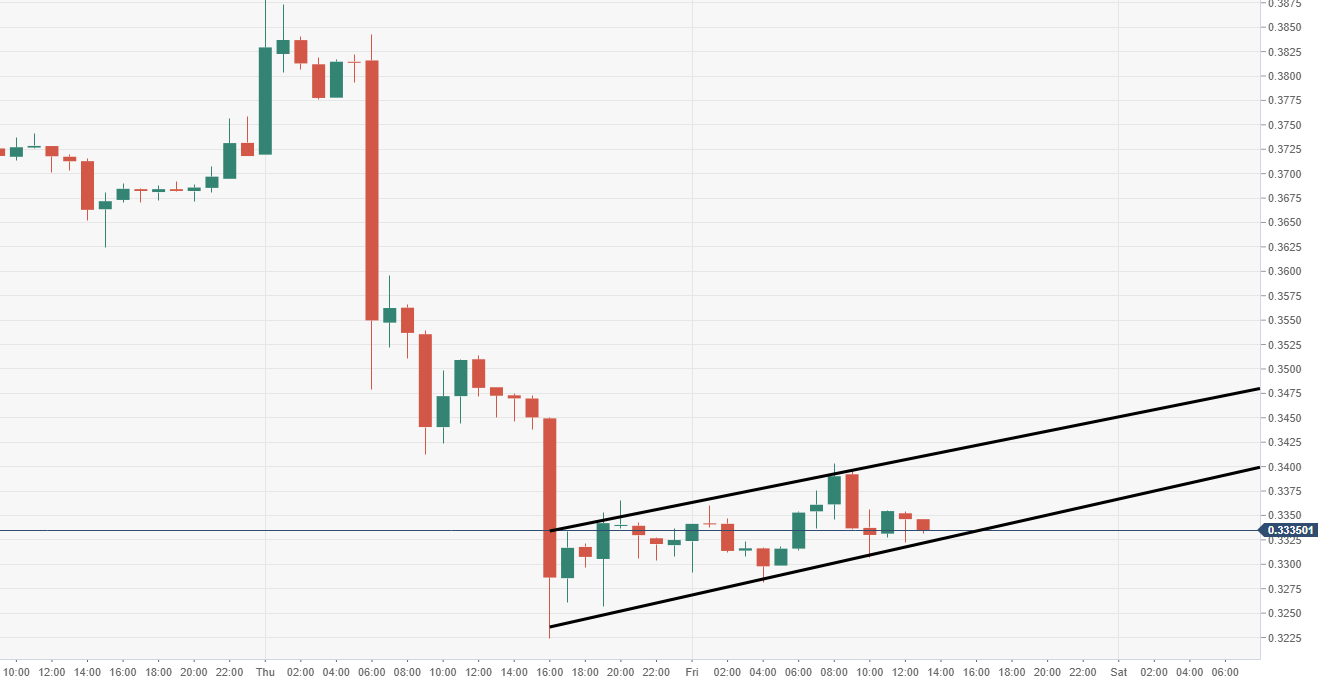
XRP/USD 60-minute chart
- XRP/USD appears to have shaped up a bearish flag pattern formation, subject to an extended break lower.
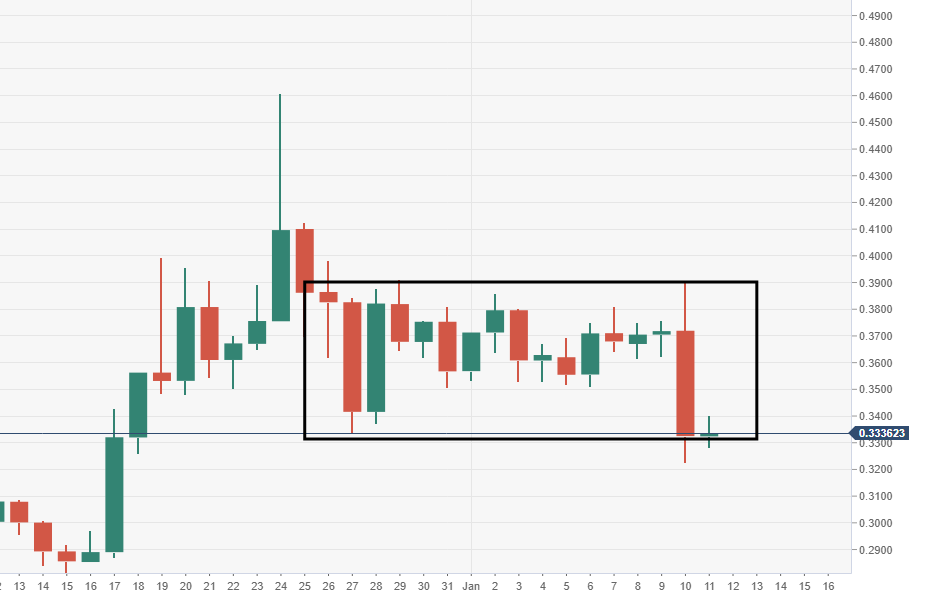
XRP/USD daily chart
- Price action is testing the lower part of a critical daily range-block formation.