- Ripple’s XRP price on Monday is trading down with minor losses of some 1.3% in the second half of the day.
- XRP/USD does have the potential for a chunky breakout to the upside, given the technical formation eyed.
XRP/USD 15-minute chart
- After breaking out from a range-block to the upside, the price has been forced back down to the south, via the 15-minute chart view.
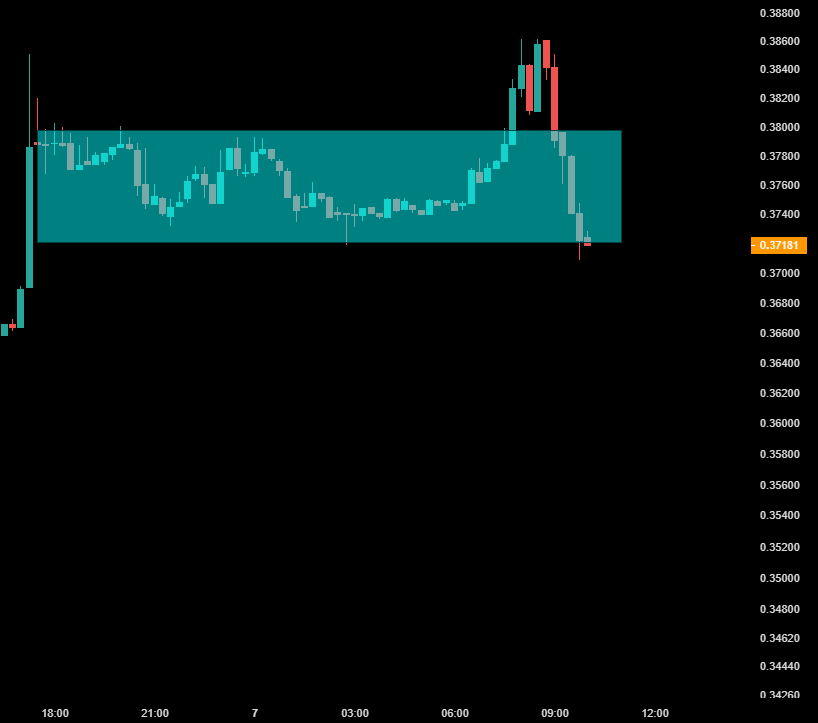
Spot rate: 0.3718
Relative change: -1.32%
High: 0.3860
Low: 0.3708
Trend: Bearish/Neutral
Support 1: 0.3623, daily pivot point support.
Support 2: 0.3581, daily pivot point support.
Support 3: 0.3542, daily pivot point support.
Resistance 1: 0.3705, daily pivot point resistance.
Resistance 2: 0.3744, daily pivot point resistance.
Resistance 3: 0.3787, daily pivot point resistance.
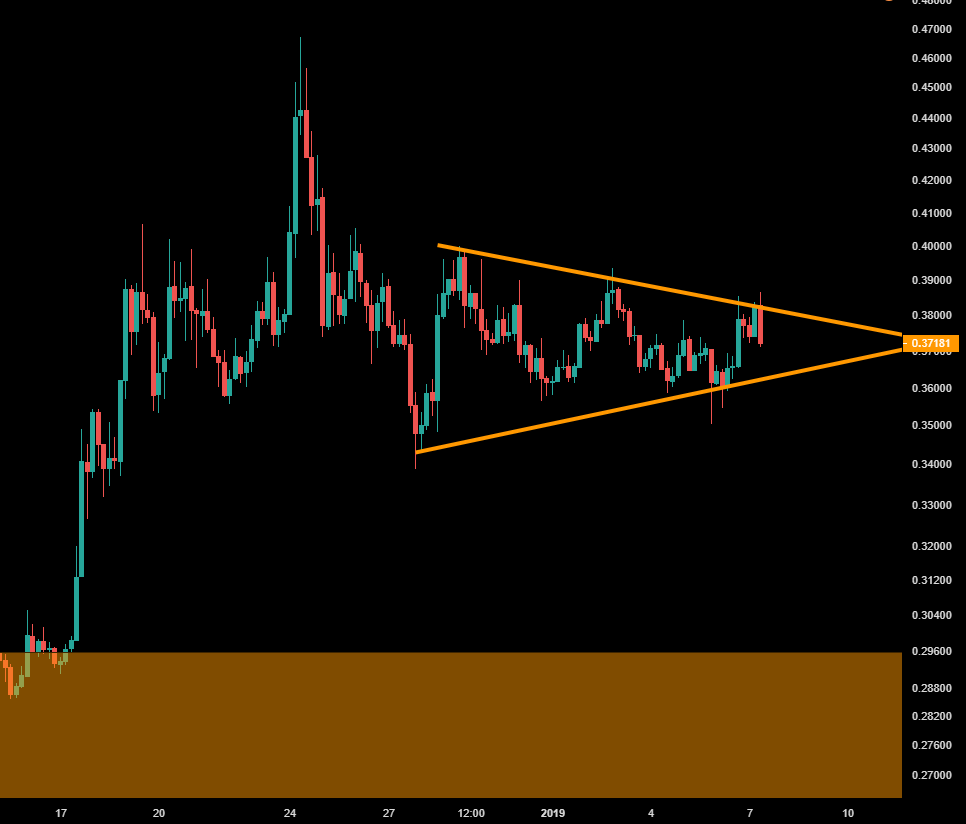
XRP/USD 4-hour chart
- Price action is narrowing within this triangular structure, subject to an imminent breakout.
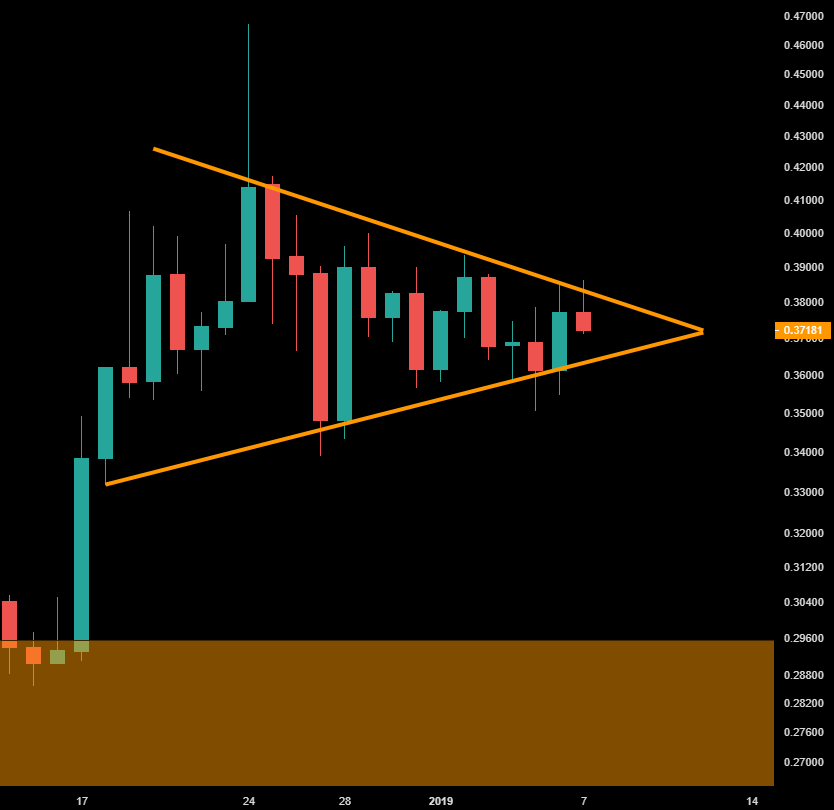
XRP/USD daily chart
- The daily chart view shows the bullish pennant pattern set up, which if broken, could see a strong wave of buying pressure.