- Ripple’s XRP was seen nursing losses of over 2% in the session on Monday.
- XRP/USD price action has formed a bearish flag pattern, subject to another potential drop.
- Since the market bottoming, the bulls have failed to commit, rallies continue to be sold.
XRP/USD 15-minute chart
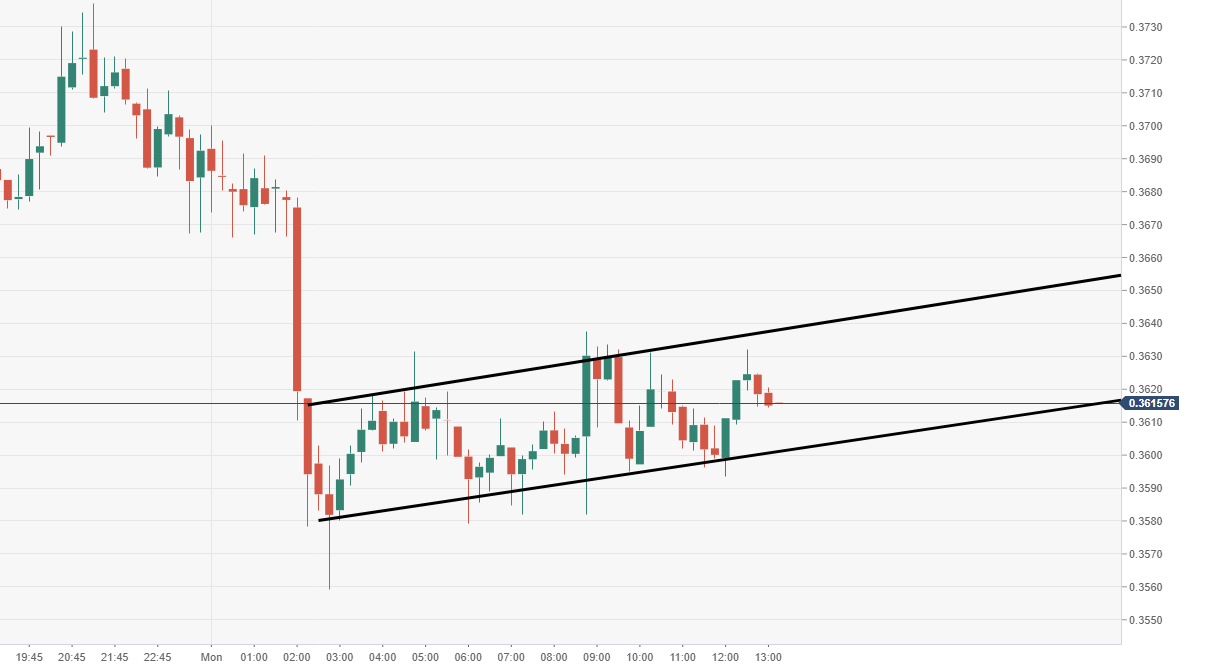
Spot rate: 0.3618
Relative change: -2.11%
High: 0.3637
Low: 0.3559
Trend: Bearish
Support 1: 0.3601, lower support of flag.
Support 2: 0.3540, daily pivot point support.
Support 3: 0.3438, daily pivot point support.
Resistance 1: 0.3640, upper part of flag.
Resistance 2: 0.3795, daily pivot point resistance.
Resistance 3: 0.3897, daily pivot point resistance.
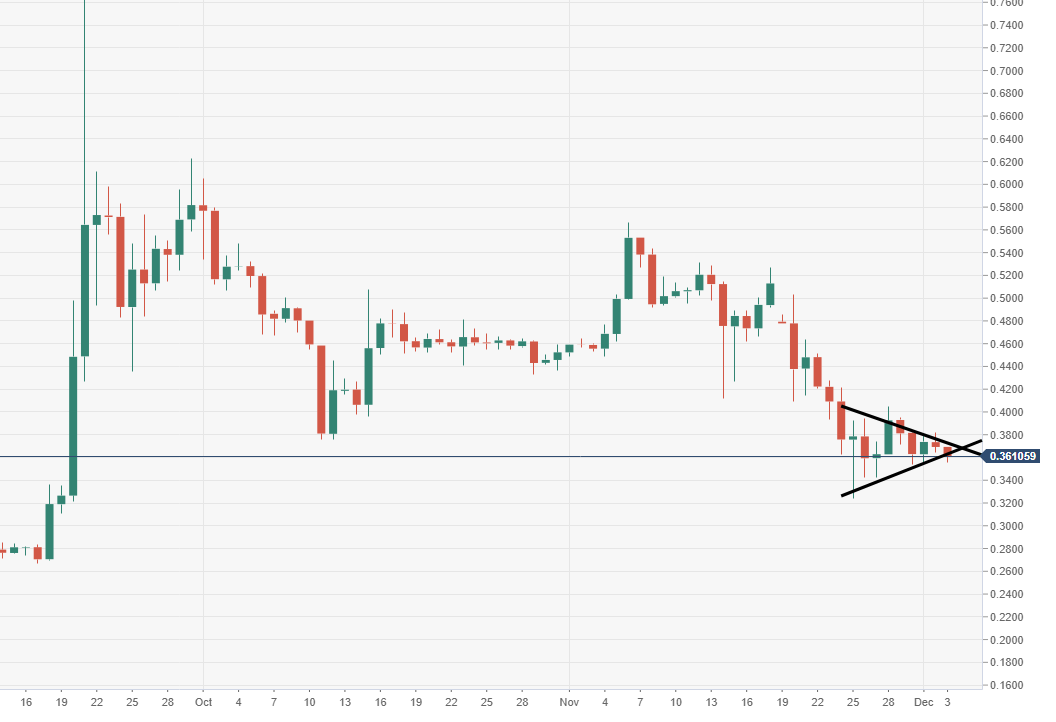
XRP/USD daily chart
- Price action is moving within a bearish pennant pattern formation, seen via the daily chart view.