- XRP was seen down as much as 4.5% through the mid-point of trading on Monday.
- The falling price of XRP/USD was caught by some support at the $0.4400, within a known demand area.
- Prices weighted to the downside across the board, with a notable pick up in volumes.
- Any failure of $0.4400 area holding, a fast move back towards the $0.4000 mark could come into play.
- RSI currently demonstrates XRP/USD has dipped into oversold territory.
XRP/USD 4-hour chart
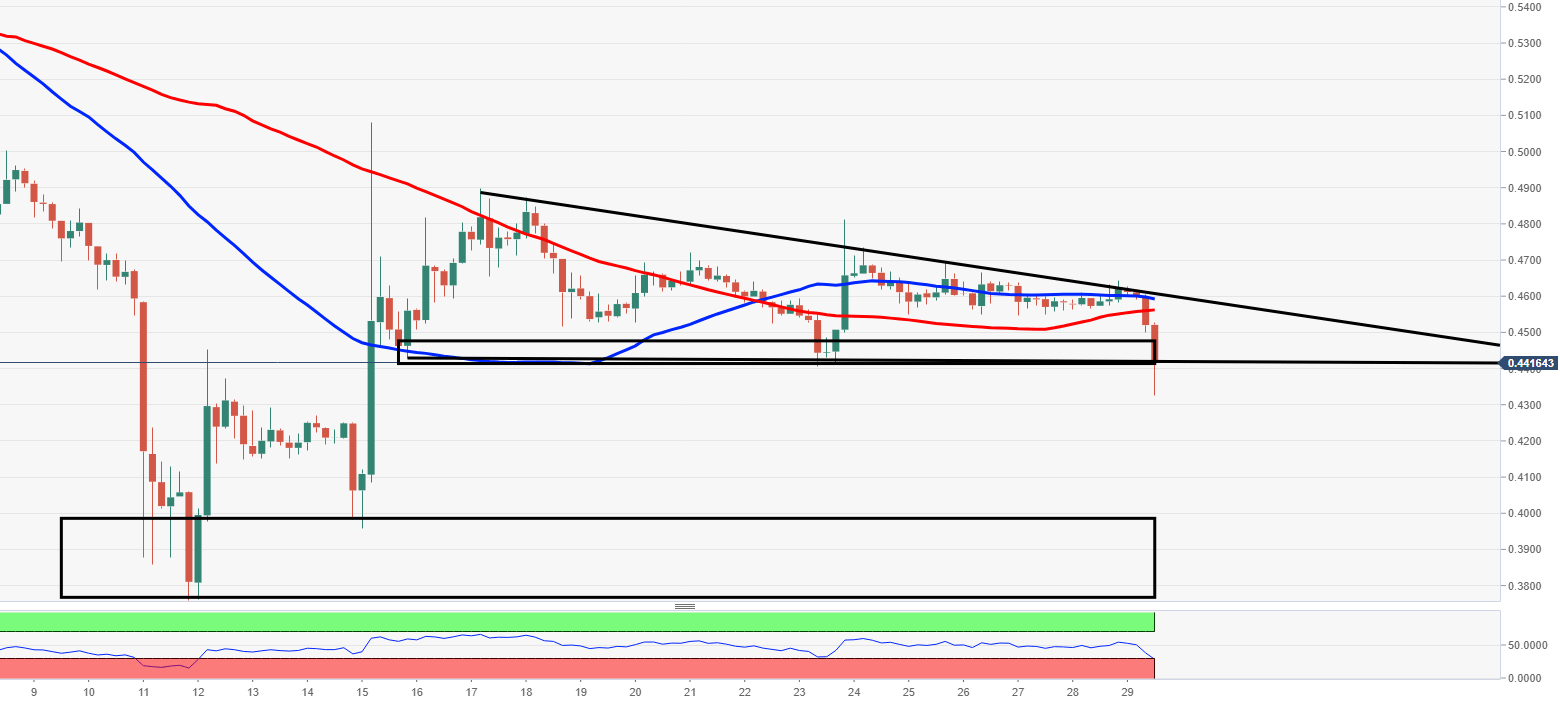
Spot rate: 0.44176
Relative change: +0.10%
High: 0.46260
Low: 0.43294
Trend: Bearish
Support 1: 0.44000, lower part of pennant pattern & demand area.
Support 2: 0.41700, consolidation area 12-14 October.
Support 3: 0.40000, big area of support and demand zone.
Resistance 1: 0.45610, 100MA.
Resistance 2: 0.46000, 50MA & upper part of pennant.
Resistance 3: 0.48500, resistance on 4-hour chart.
