- SAFEMOON price looks to the moon after a series of encouraging tweets.
- Bulls flirt with record highs, with eyes on $0.000010.
- RSI probes overbought zone on the daily chart.
After a crash witnessed towards the end of last month, SAFEMOON buyers have returned in the first week of May, showcasing a stellar performance.
The price is up nearly 13% in the past 24 hours while adding about 6% over the last hour, holding near record highs at $0.0000084.
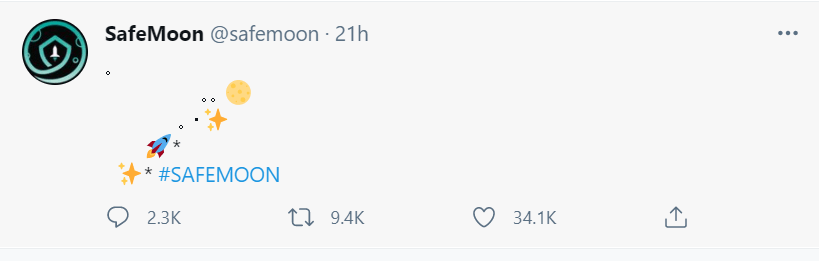
The blistering rally in SafeMoon got triggered following a tweet by the auto-generating liquidity protocol, citing: Incredible! #SAFEMOON now has more watchers on @CoinMarketCap than #BTC THANK YOU!
The SAFEMOON price caught a fresh bid-wave on Friday after yet another tweet from SafeMoon, announcing that there are “1.7 MILLION #SAFEMOON HOLDERS!”
The cherry on the cake was the tweet, which was represented by emojis, showing that the price is likely to rocket towards the moon.
SAFEMOON/USD: Targets $0.000010 if the 123.6% Fibo level is taken out
SAFEMOON bulls are catching a breath before building strength for another record run.
Immediate resistance is aligned at $0.0000086, which the Fibonacci 123.6% of the sell-off from April 20 high to May 2 low.
A daily close above the mentioned resistance could power the bulls to challenge the 150% Fibo level of the same slide, placed at $0.000010.
Further upside appears elusive, as the relative strength index (RSI) has already sneaked into the overbought territory, currently at 70.44.
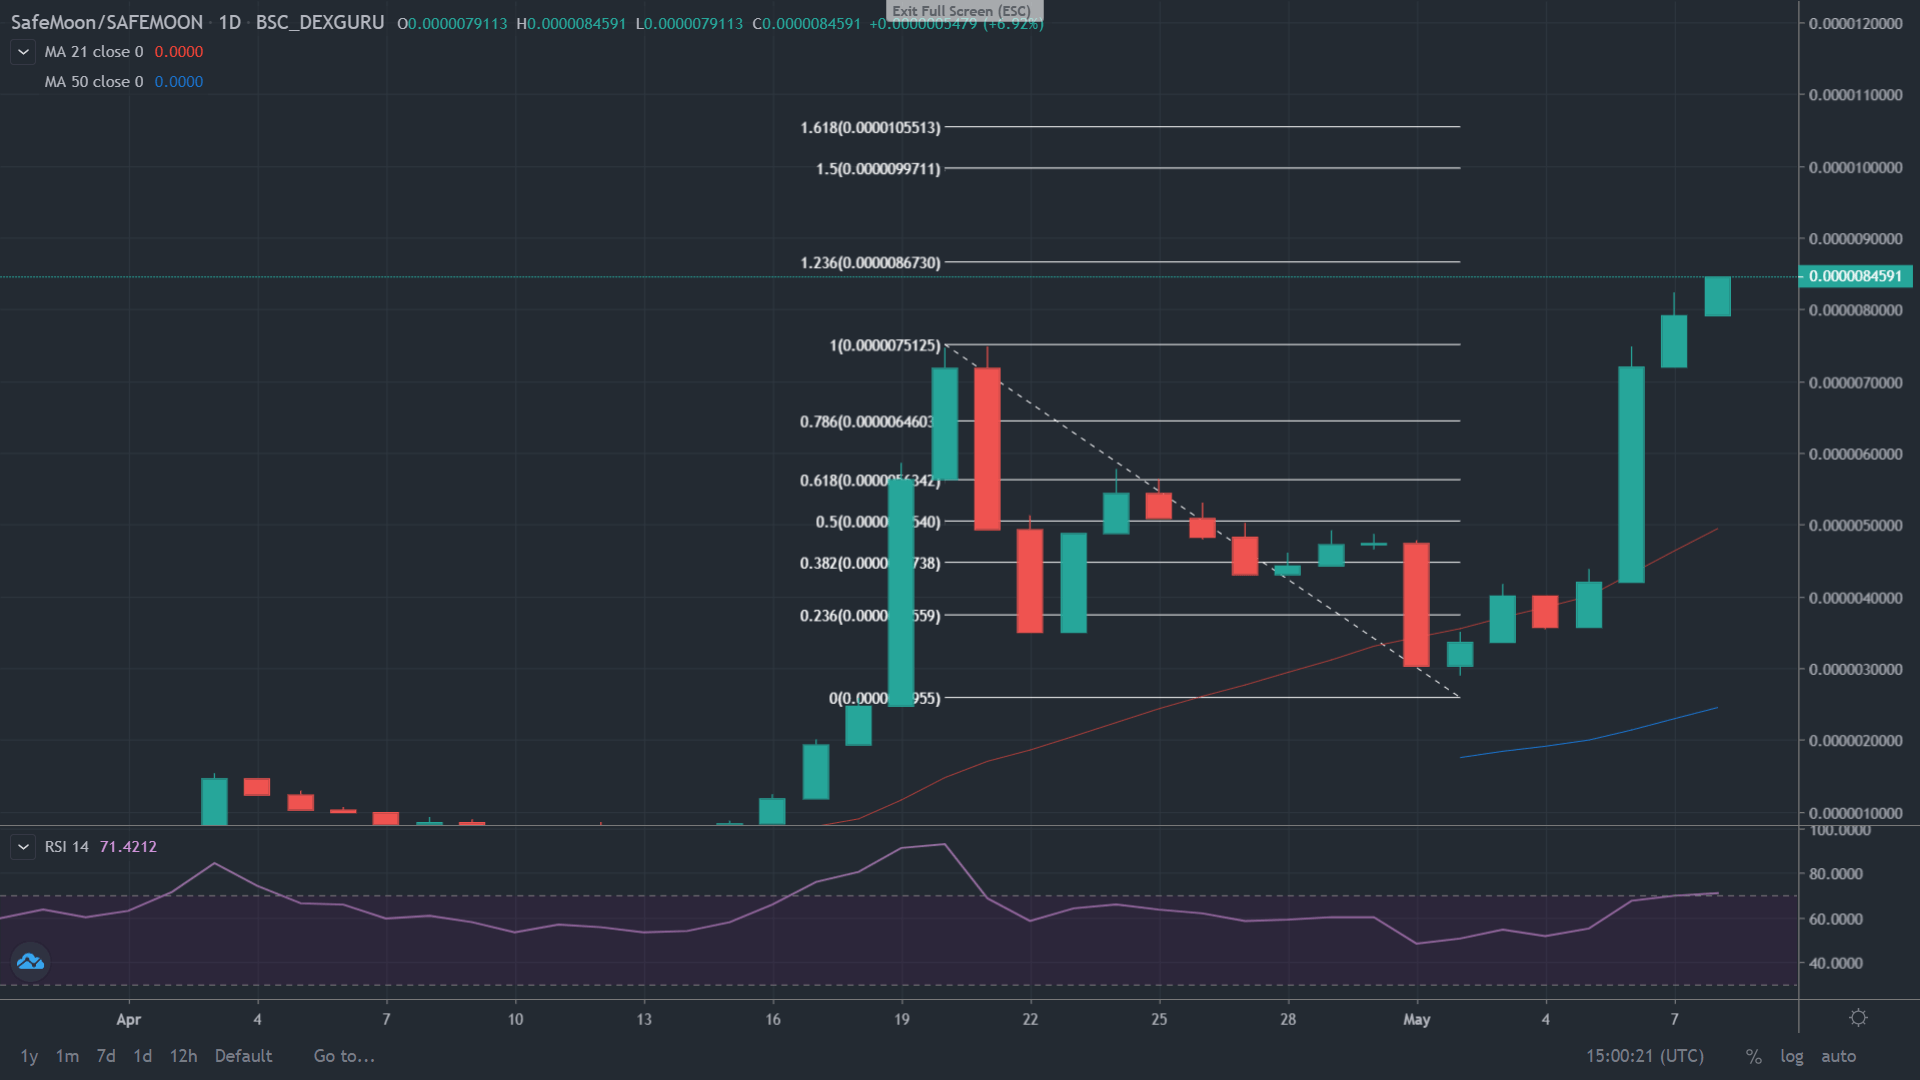
SAFEMOON/USD: Daily chart
Any retracement is likely to meet the initial demand at Friday’s low of $0.0000071.
Sellers could then target the 78.6% Fibo level at $0.0000064 if the corrective downside gathers steam.
Acceptance under the 61.8% Fibo level at $0.0000056 could negate the bullish momentum in the near term.
