- According to recent reports, September has been the highest month of funds moved to exchanges since March.
- Exchange inflow directly represents an increase in selling pressure across the market.
So far, the total crypto market capitalization is down from a high of $393 billion on September 1 to a current number of $327 billion, representing a $66 billion loss. For comparison, the crash on March 12 wiped around $170 billion in market capitalization.
We have a wide array of on-chain metrics that can help investors anticipate the next market move. Exchange inflow represents the number of cryptocurrencies that are getting deposited into exchanges. We can assume that most of the coins getting deposited will be sold, or at least investors are getting ready to sell them in the case of a bigger drop. Either way, the number represents the weakness of the market and selling pressure.
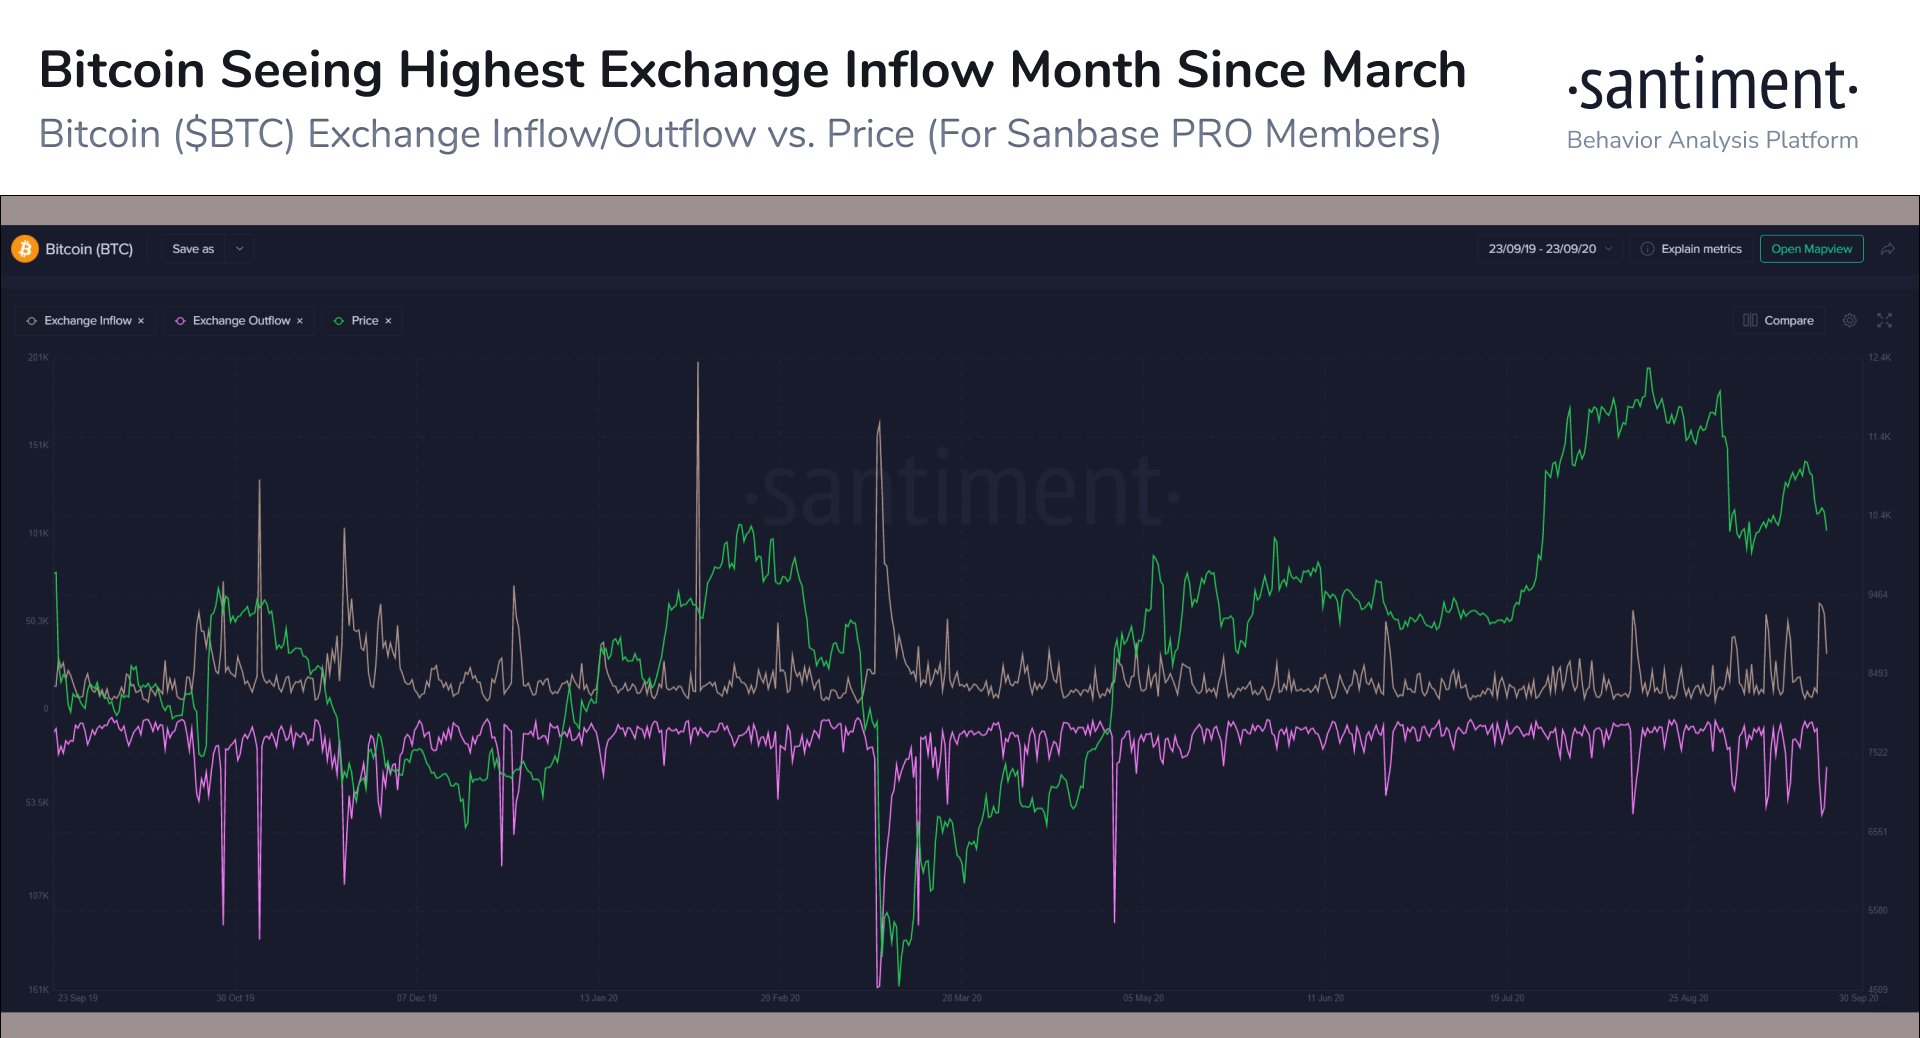
Data from santiment shows a notable increase in exchange inflow during September with several peaks right after the collapse on September 2. Although the peak in March was higher, September is seeing a constant inflow of cryptocurrencies to exchanges.
BTC/USD daily chart
-637365497592305370.png)
We know $10,000 is a critical support level for Bitcoin. Bulls have defended this level several times in the past, even though the price did pierce through it before recovering. According to Bitcoin’s daily confluence detector, the downside, if it continues, it’s capped at $9,700, right where the most recent CME gap is standing.
Bitcoin Holders Distribution
%20%5B15.13.15,%2024%20Sep,%202020%5D-637365500018977415.png)
Surprisingly, despite the high exchange inflow, the number of Bitcoin whales seems to be increasing notably. Investors holding between 10,000 and 100,000 BTC are on the rise from only 104 on September 16 to 108 currently. This metric would seem to counteract the increase in selling pressure as it shows whales are willing to continue buying the digital asset.
In the short-term, if whales continue buying, we could see Bitcoin jump back up to re-test $11,000 and the entire market $355 billion.
