- The sum of stablecoins inside exchanges has reached a new all-time high, indicating big buying pressure.
- The cryptocurrency market has recently suffered a pullback, but bulls are ready to re-enter.
- In the past, a high number of stablecoins inside exchanges represented good buying opportunities.
On January 10, 2021, the cryptocurrency market capitalization reached an all-time high of $1.11 trillion. Shortly after, Bitcoin suffered a major pullback and most coins followed suit. Many investors and analysts believe this could be a local bottom and a good opportunity to re-enter.
Stablecoins are key to Bitcoin’s recovery
The increase in stablecoins reserves inside exchanges can happen for two main reasons. One, Bitcoin and the market are plummeting and investors are selling their coins, which increases the number of stablecoins on exchanges.
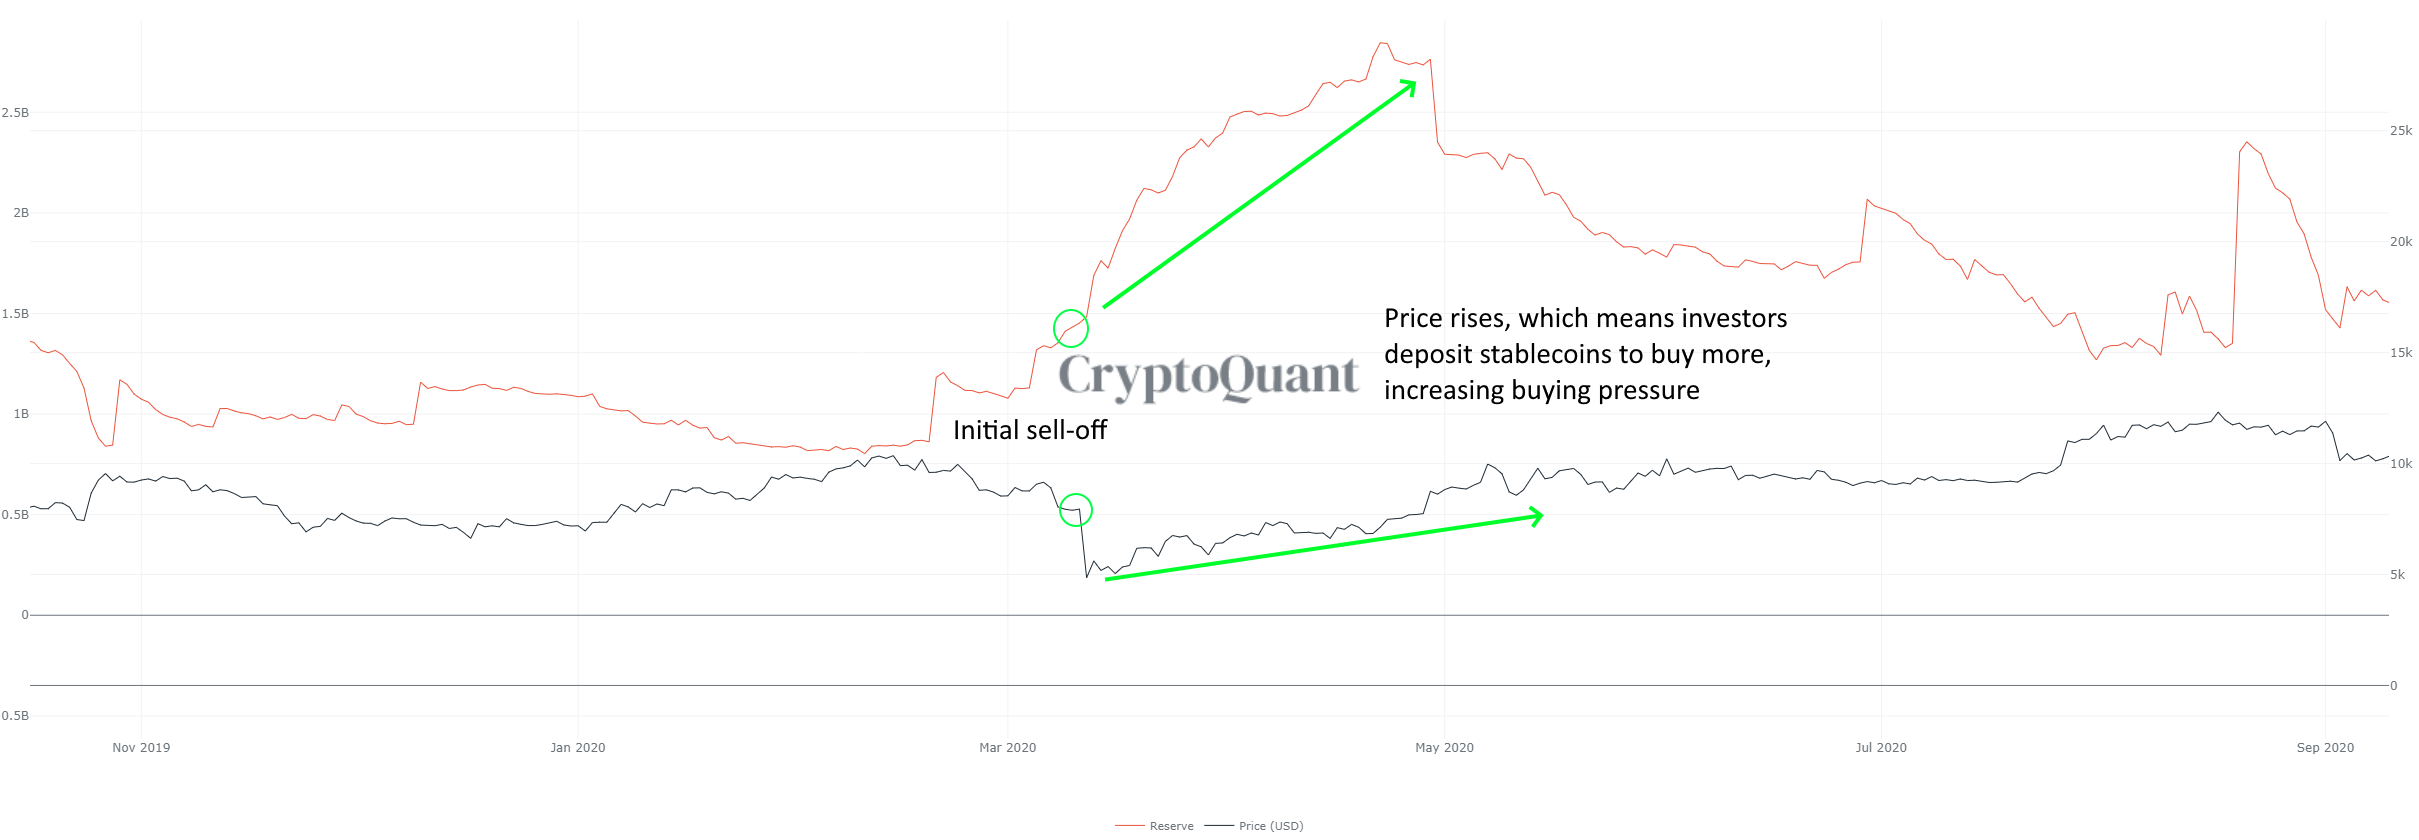
Bitcoin vs Stablecoins Reserves chart
However, if this reserve continues to rise even after the initial sell-off is finished, it means investors are depositing stablecoins with the idea of buying the dip. Initially after Bitcoin’s sell-off, the stablecoins reserves increased because of investors selling, as shown in the chart above. However, the price started to recover while the number of stablecoins continued to rise, indicating that investors were ready to buy the dip.
-637472667196333344.png)
Bitcoin vs Stablecoins Reserves chart
Bitcoin’s current price is around $32,000. Back on January 2, 2021, BTC price was trading at $32,000 as well and the total stablecoin reserve was about $3.13 billion. Currently, it is $4.12 billion, despite Bitcoin price being the same. This indicates that around $1 billion of stablecoins have been deposited into exchanges with the intention to buy the dip.
What’s the best time to buy Bitcoin’s dip?
Bitcoin has established a descending triangle pattern with a support level of around $30,000 on the 12-hour chart. So far, bulls have defended the psychological support point of $30,000 several times. Aggressive buyers can enter now expecting Bitcoin price to crack the resistance trendline at $33,300.
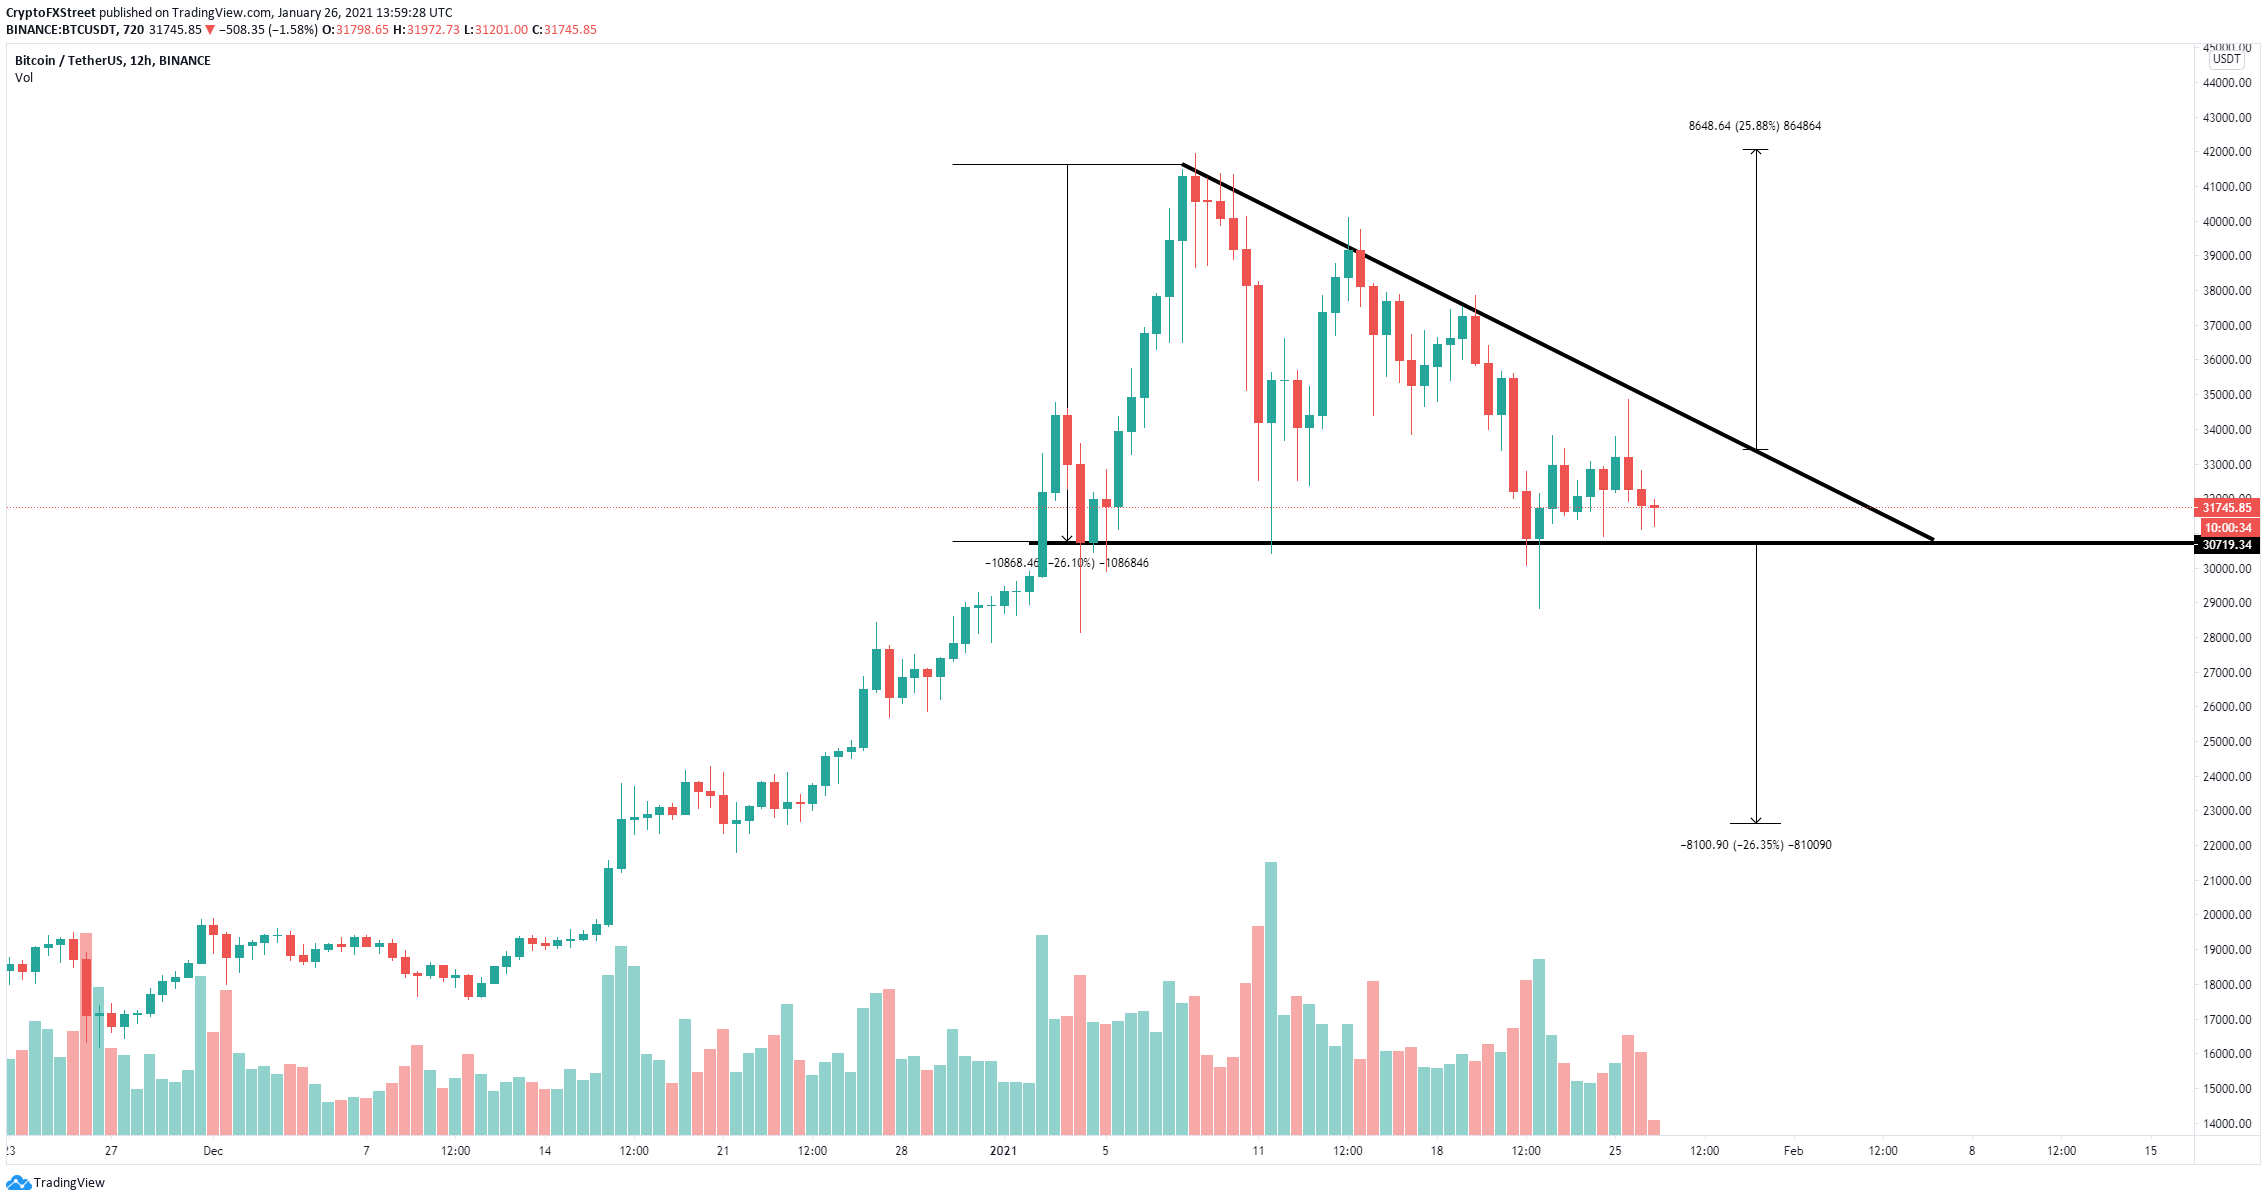
BTC/USD 12-hour chart
A breakout above $33,300 could send Bitcoin price to its previous all-time high of $41,950. However, losing the $30,000 psychological support level would be a significant blow for the bulls.
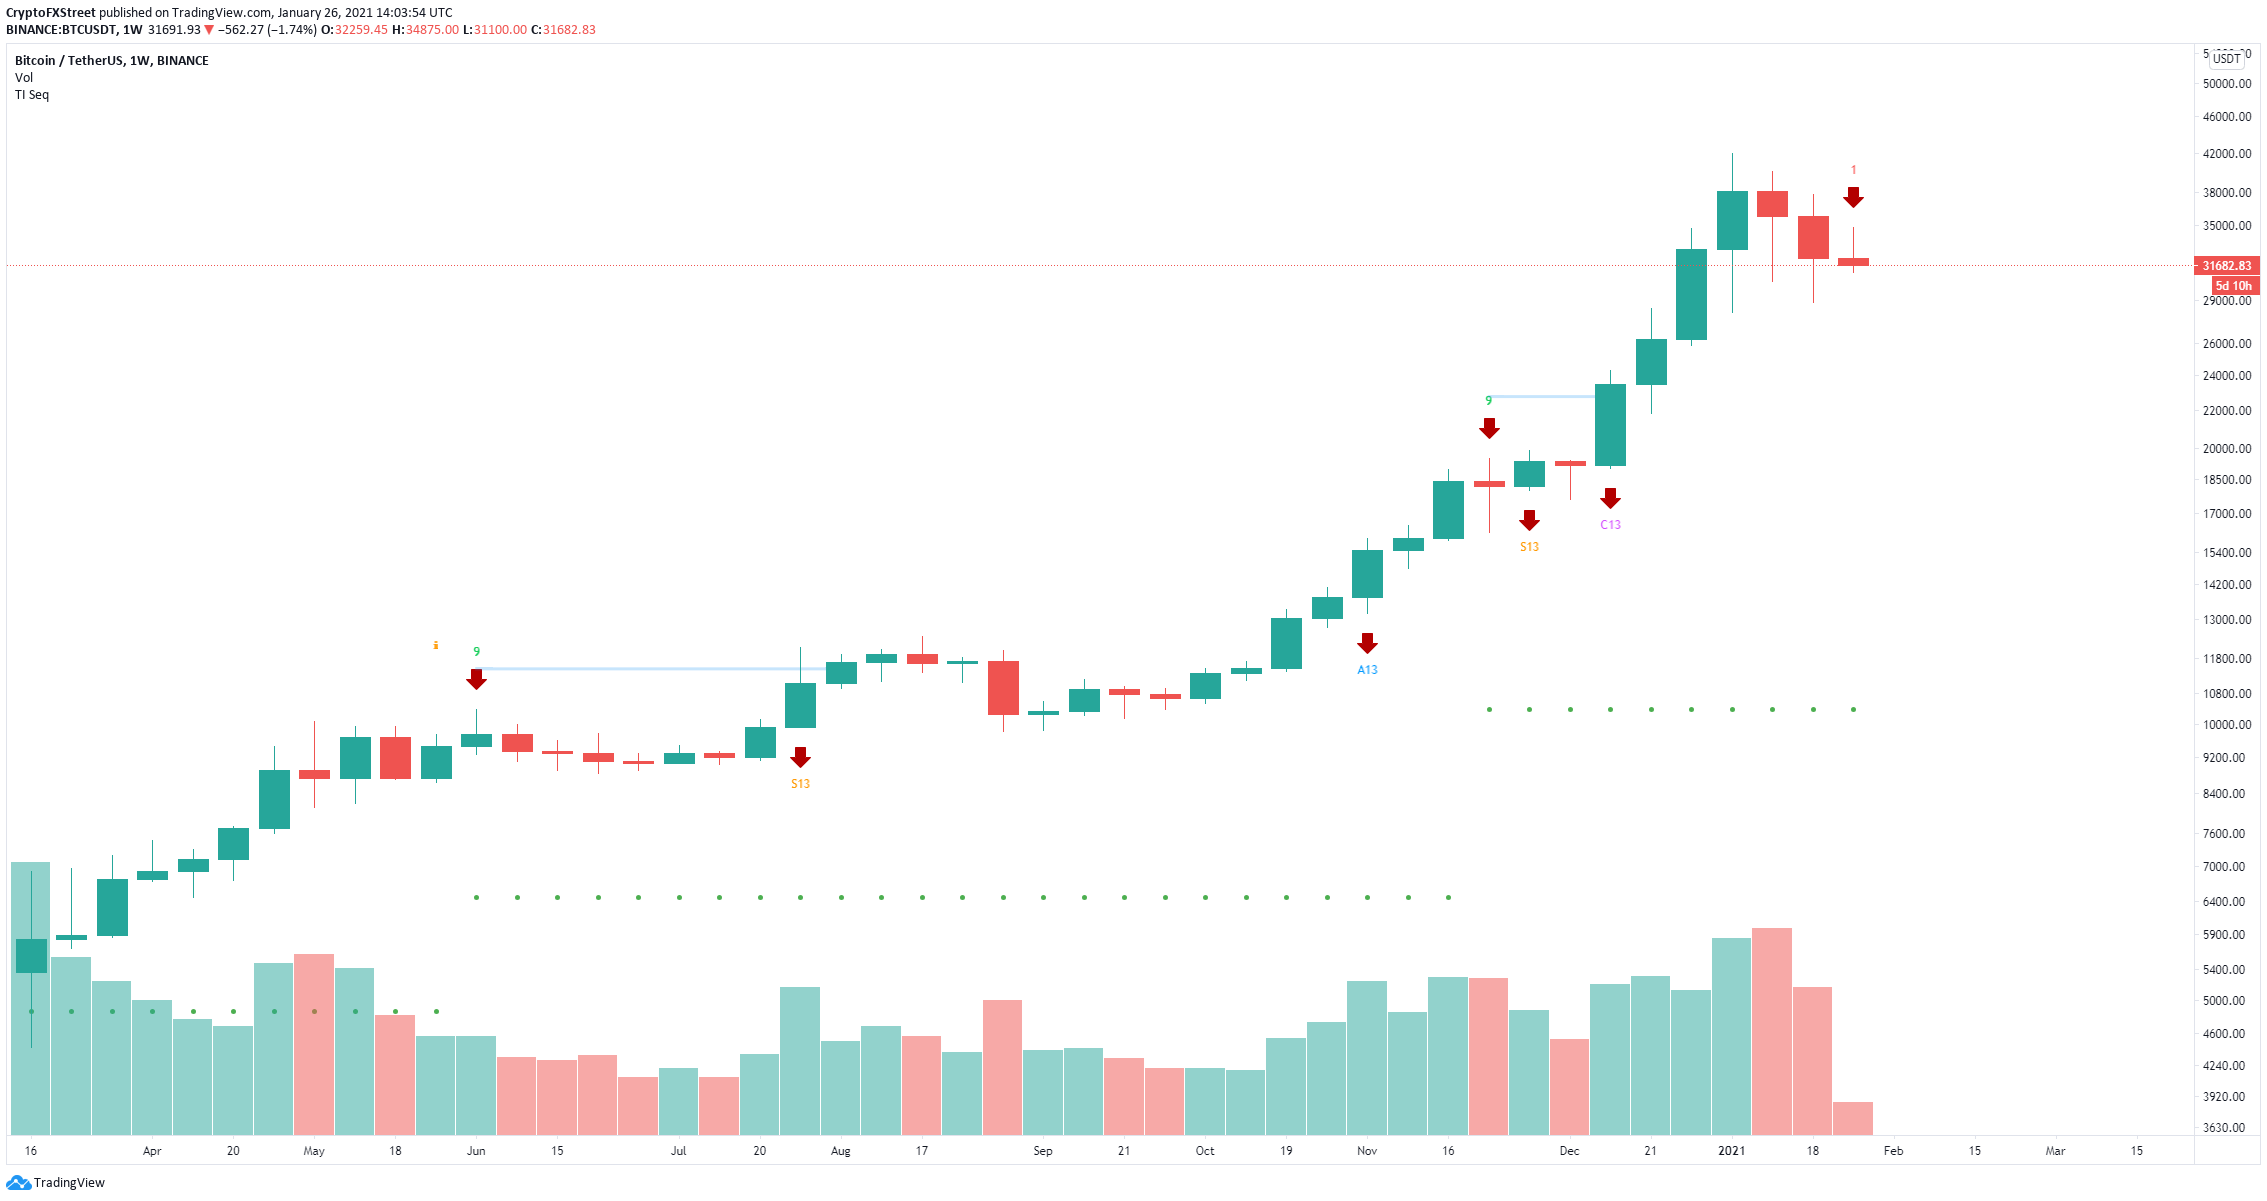
BTC/USD weekly chart
A breakdown below the support trendline of the pattern could drive Bitcoin price down to $22,000. On the weekly chart, the TD Sequential indicator has presented a sell signal, in the form of a green nine candle, which adds credence to the bearish outlook.
