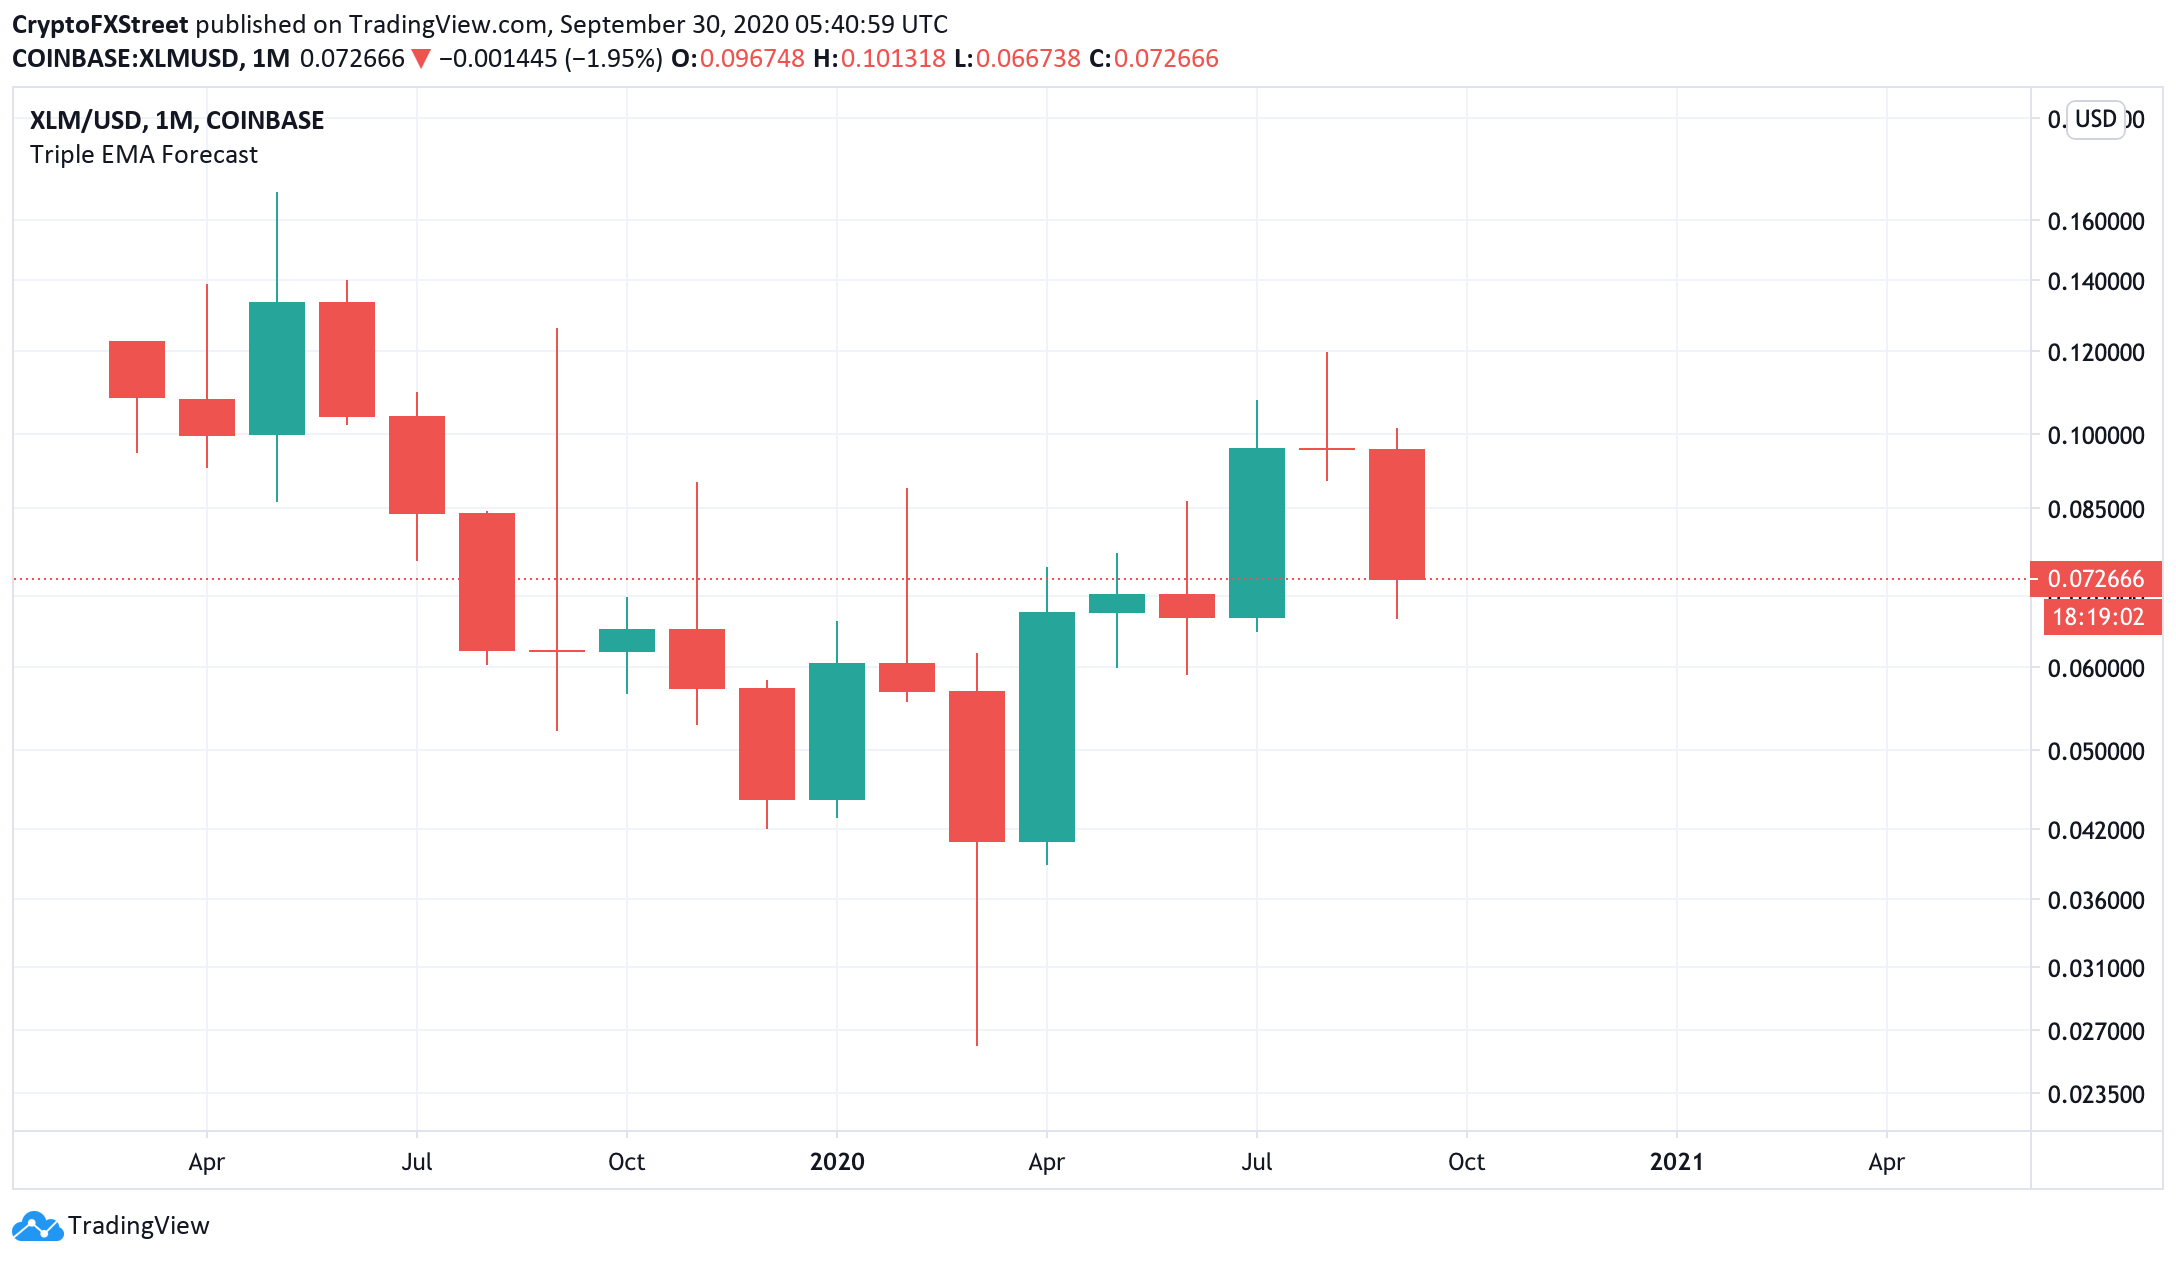
- An Evening Star on a monthly chart bodes ill for Stellar (XLM).
- The price needs to regain $0.08 to improve the technical picture.
Stellar (XLM) is the 18th largest digital asset with a current market capitalization of $1.5 billion and an average daily trading volume of $115 million. The coin is most actively traded at Binance against USDT and BTC. The coin, created by Jed McCaleb, came to life in July 2014 as a primary competitor of Ripple.
In the recent interview with Coinmarketcap, Jed McCaleb explained the crucial rationale behind the project:
The whole original design of Stellar is that you can have fiat currencies and other kinds of forms of value run in parallel with each other and with crypto assets. This is super important to drive this stuff mainstream.
Stellar topped at $0.17 in May 2019 and hit the all-time low of $0.026 in March 2020 amid the significant sell-off on the cryptocurrency marker caused by COVID-19 panic. Since that time, the coin managed to recover to $0.12; however, the further price movements may be less impressive as the technical picture sends ominous signals.
XLM/USD: The technical picture
At the time of writing, XLM/USD is changing hands at $0.072. In September, the coin has lost over a quarter fo its value, and the worst may not be over yet. On the monthly chart, XLM seems to have printed an evening Doji star, one of the most powerful candlestick patterns with bearish connotations.
XLM/USD monthly chart
The evening star is a reversal pattern consisting of three candles. A long green candle brings the price to a new high. It is followed by a candle with a long upper shadow and a small or no body, signaling that the buying potential is fading away. The formation is finished by a big red candle, which predicts that the decline will continue to even lower lows.
According to Thomas Bulkowski, an expert on chart patterns, an Evening Start has a 72% accuracy rate, which makes it a reliable technical indicator. Let’s zoom in to a weekly chart to see if the long-term bearish signal is confirmed here.
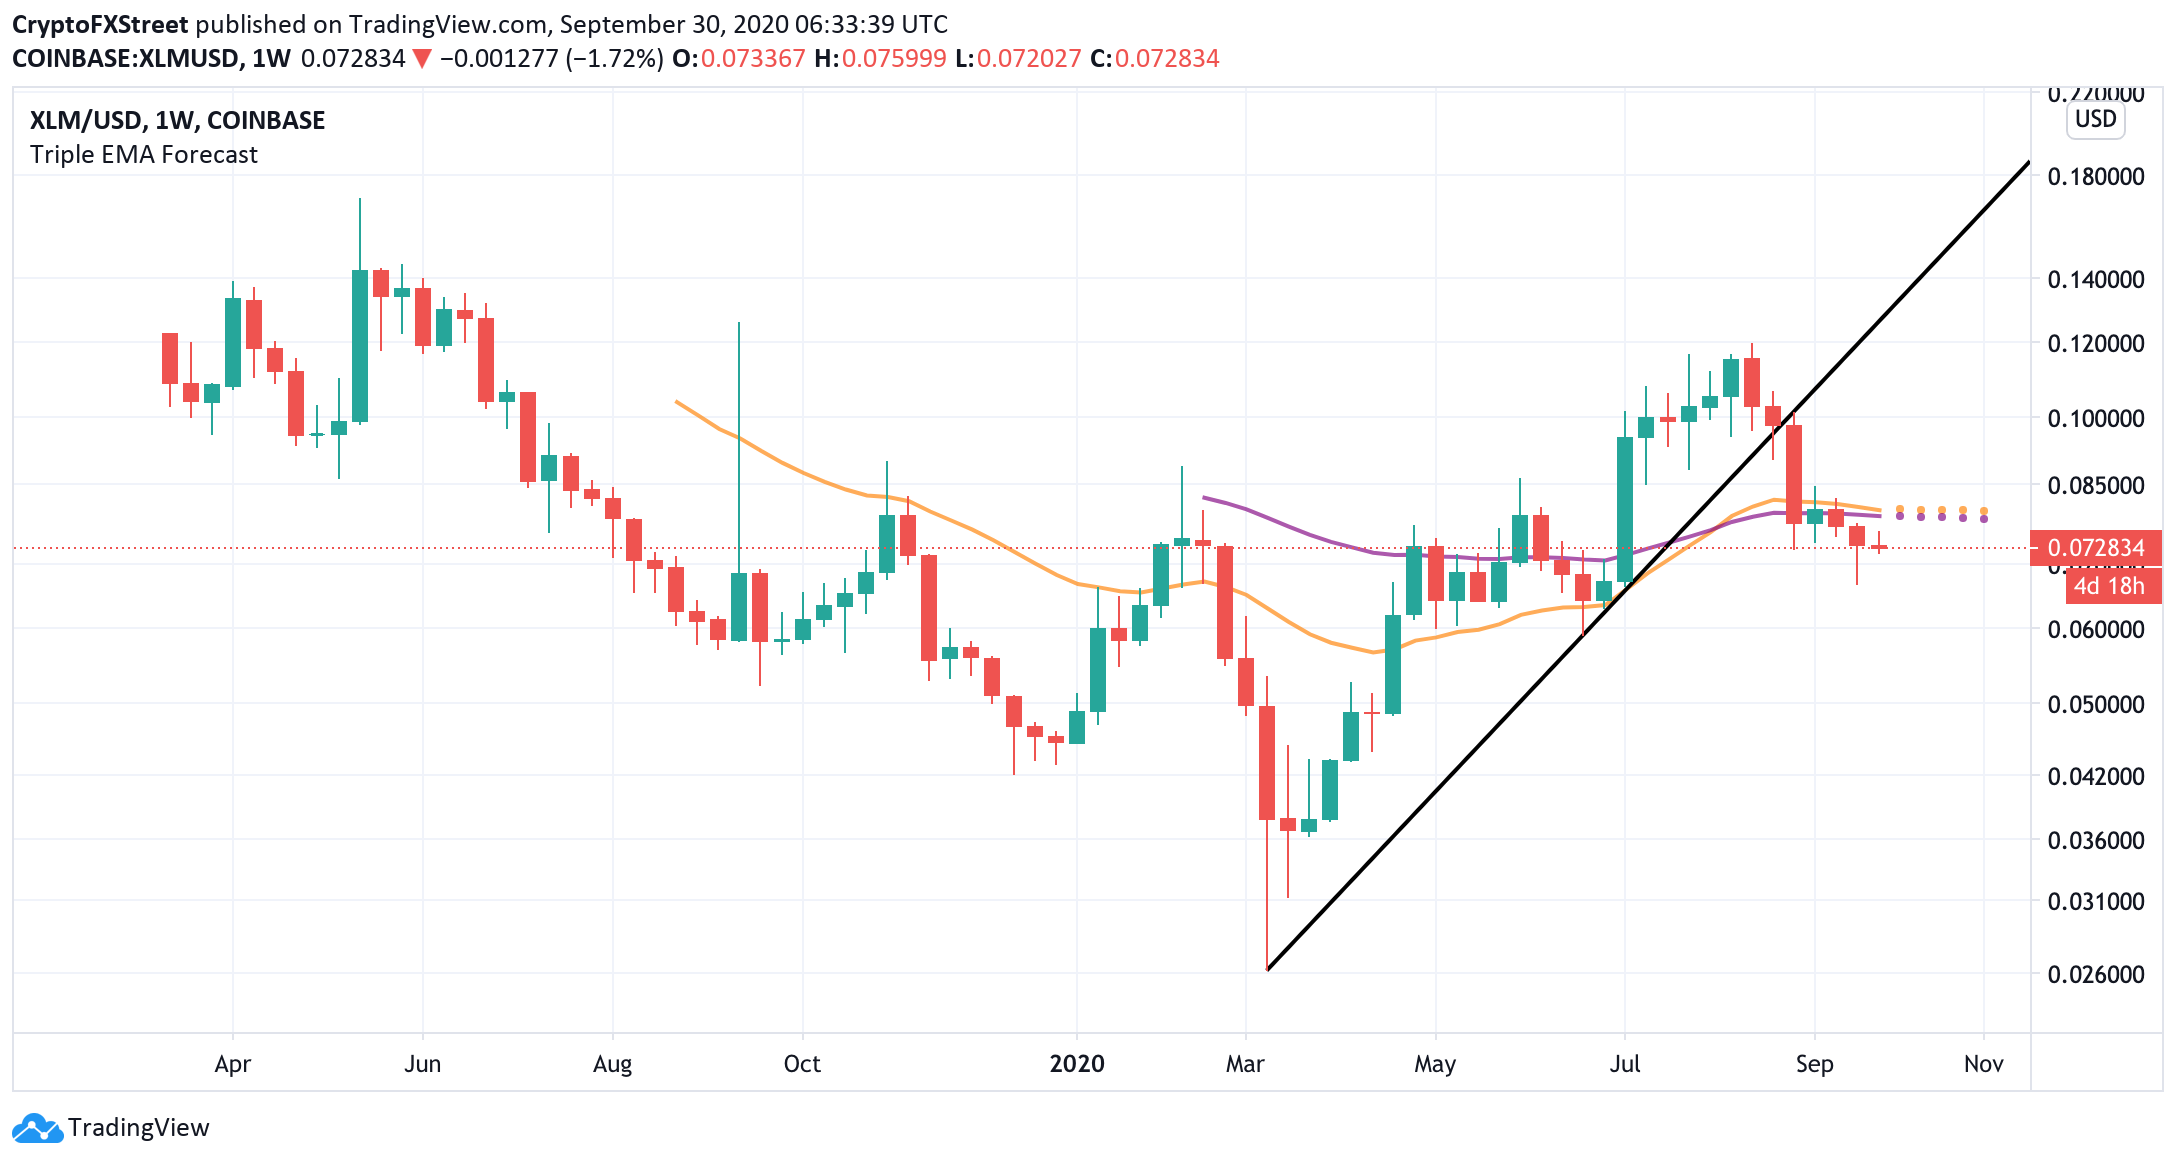
XLM/USD weekly chart
On a weekly chart, XLM/USD broke below the upside trendline from the March low and continued drifting lower until it hit $0.066. While the price managed to recover from the trough, the upside is still limited by a potent combination of the short-term and mid-term EMAs (exponential moving averages) on approach to $0.08.
A sustainable move above this area is needed to mitigate the immediate bearish pressure and improve the technical picture. Otherwise, the sell-off may continue towards the recent low of $0.066 and to $0.05.
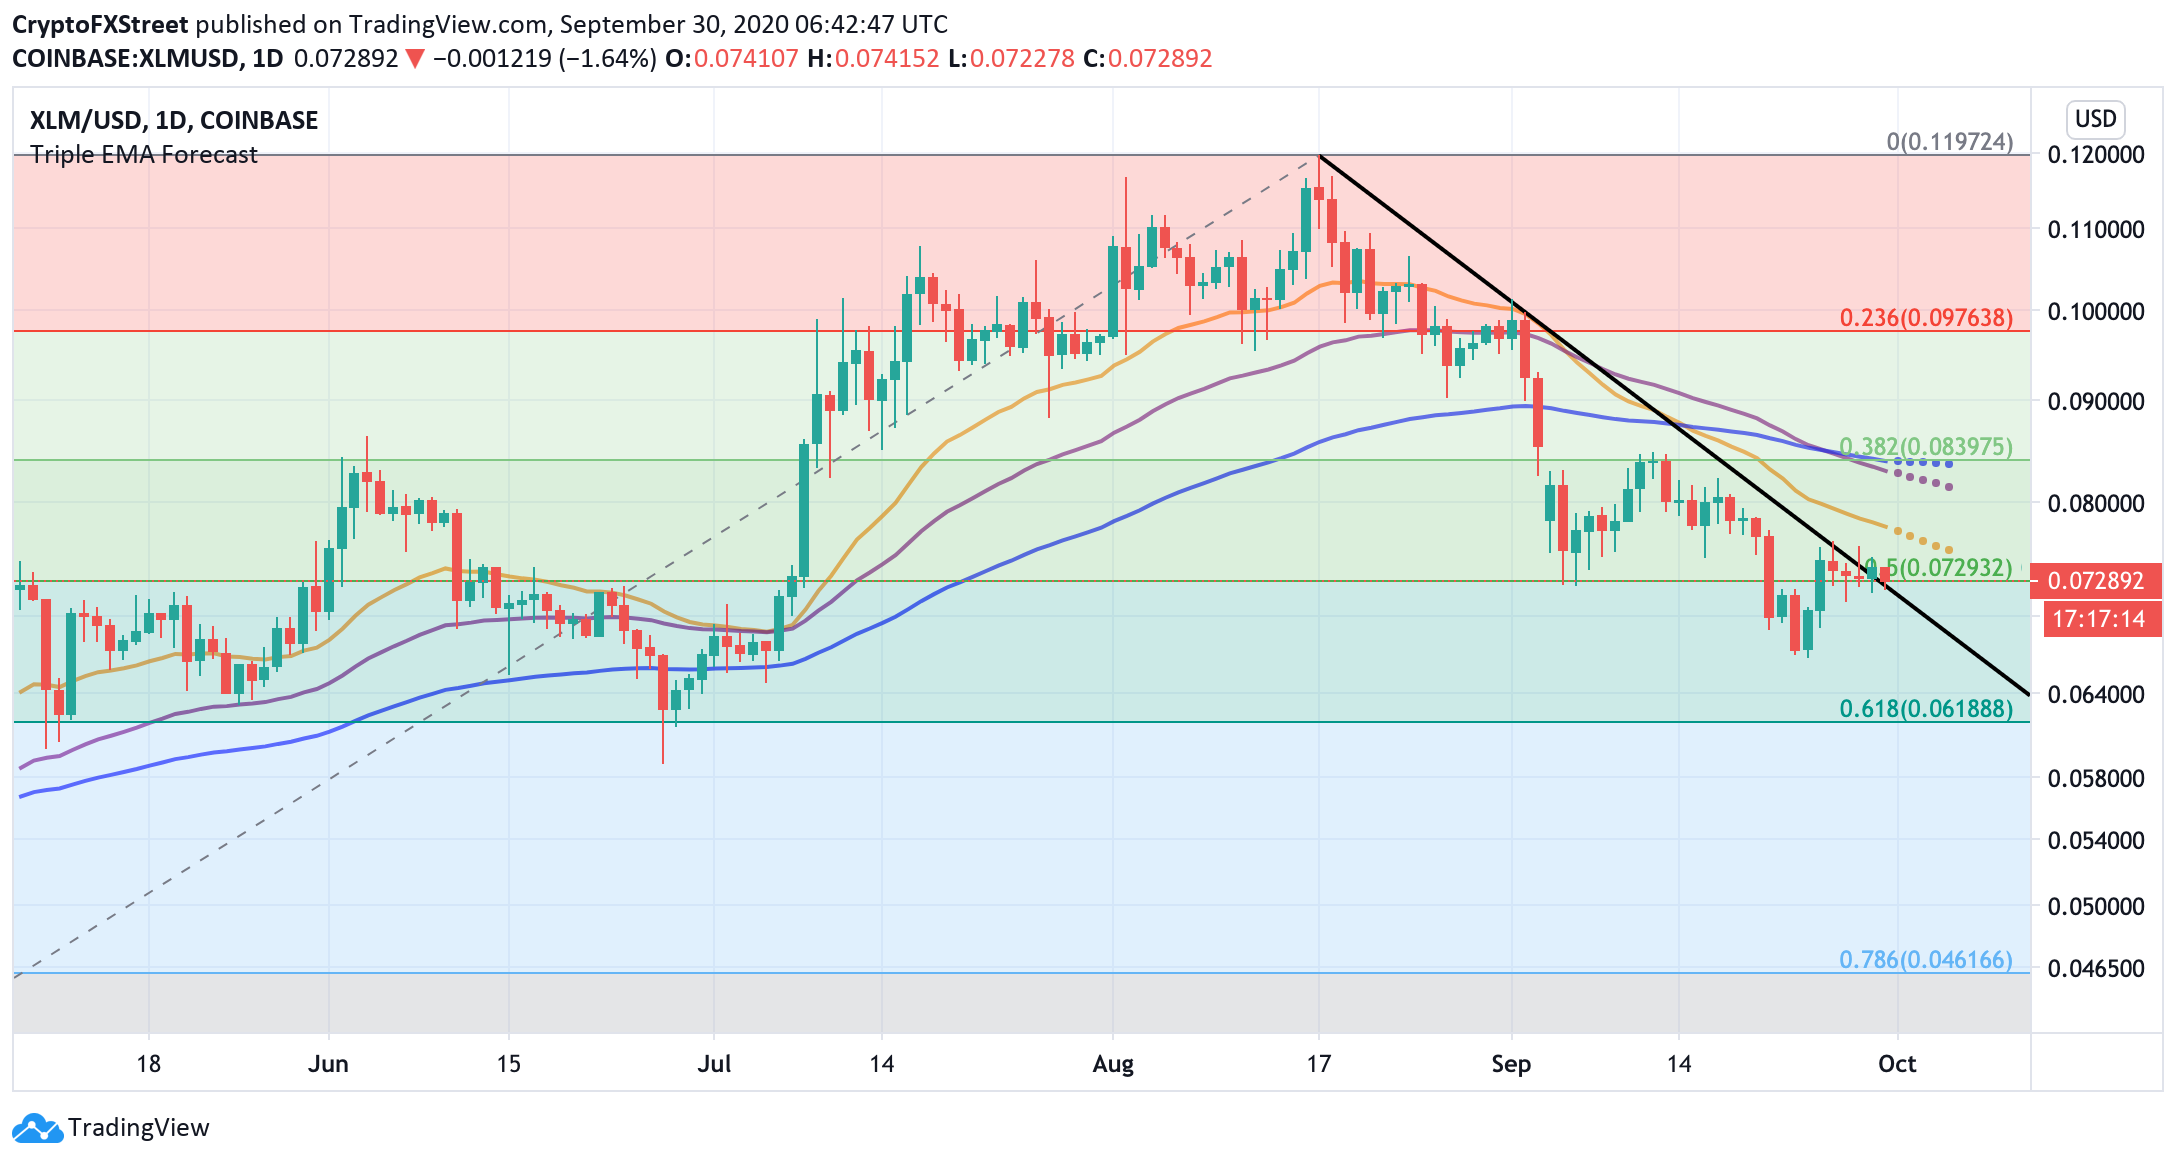
XLM/USD daily chart
Meanwhile, on a daily chart, XLM/USD is hovering around 50% Fib from March low to the recent high. If this barrier is broken, the sell-off may be extended towards the 61.8% Fib at $0.06, and if this one fails to hold, the 78.6% Fib at $0.46 will come into play.
On the other hand, if XLM/USD settles above the downside trendline from the August 17 high, the bulls will get a chance to take the price to $0.08. However, resistance is reinforced by a combination of daily EMAs and 38.2% Fib, making it a hard nut to crack.
To conclude: The long-term bearish signals created by the Evening Doji Star on the monthly chart are confirmed by the signals on the shorter time frames. 50% Fib at $0.072 serves as an initial barrier that separates the coin from a downside spiral towards $0.06 and potentially $0.046.
On the other hand, a recovery above $0.08 will invalidate the immediate bearish scenario and allow for an extended recovery.


