- Stellar is moving inside a descending triangle pattern.
- A sustainable move above $0.164 is needed to confirm the bullish scenario.
Stellar (XLM) hit a recent top at $0.23 on November 26 and has retreated to $0.16 by the time of writing. The 11th largest digital asset with a current market capitalization of $3.5 billion has lost over 6.5% in the recent 24 hours and 12% on a week-to-week basis.
Stellar’s trading volumes dropped from over $2 billion by the end of November to just $350 million per day currently. The coin is most actively traded on Binance, Huobi Global, and OKEx.
Stellar bulls plot a massive comeback
From the technical point of view, XLM is moving inside a descending triangle pattern visible on the 4-hour chart. If the support created by the x-axis of the triangle around $0.15 continues to hold, the coin may be poised for a strong rebound with the estimated target at $0.21.
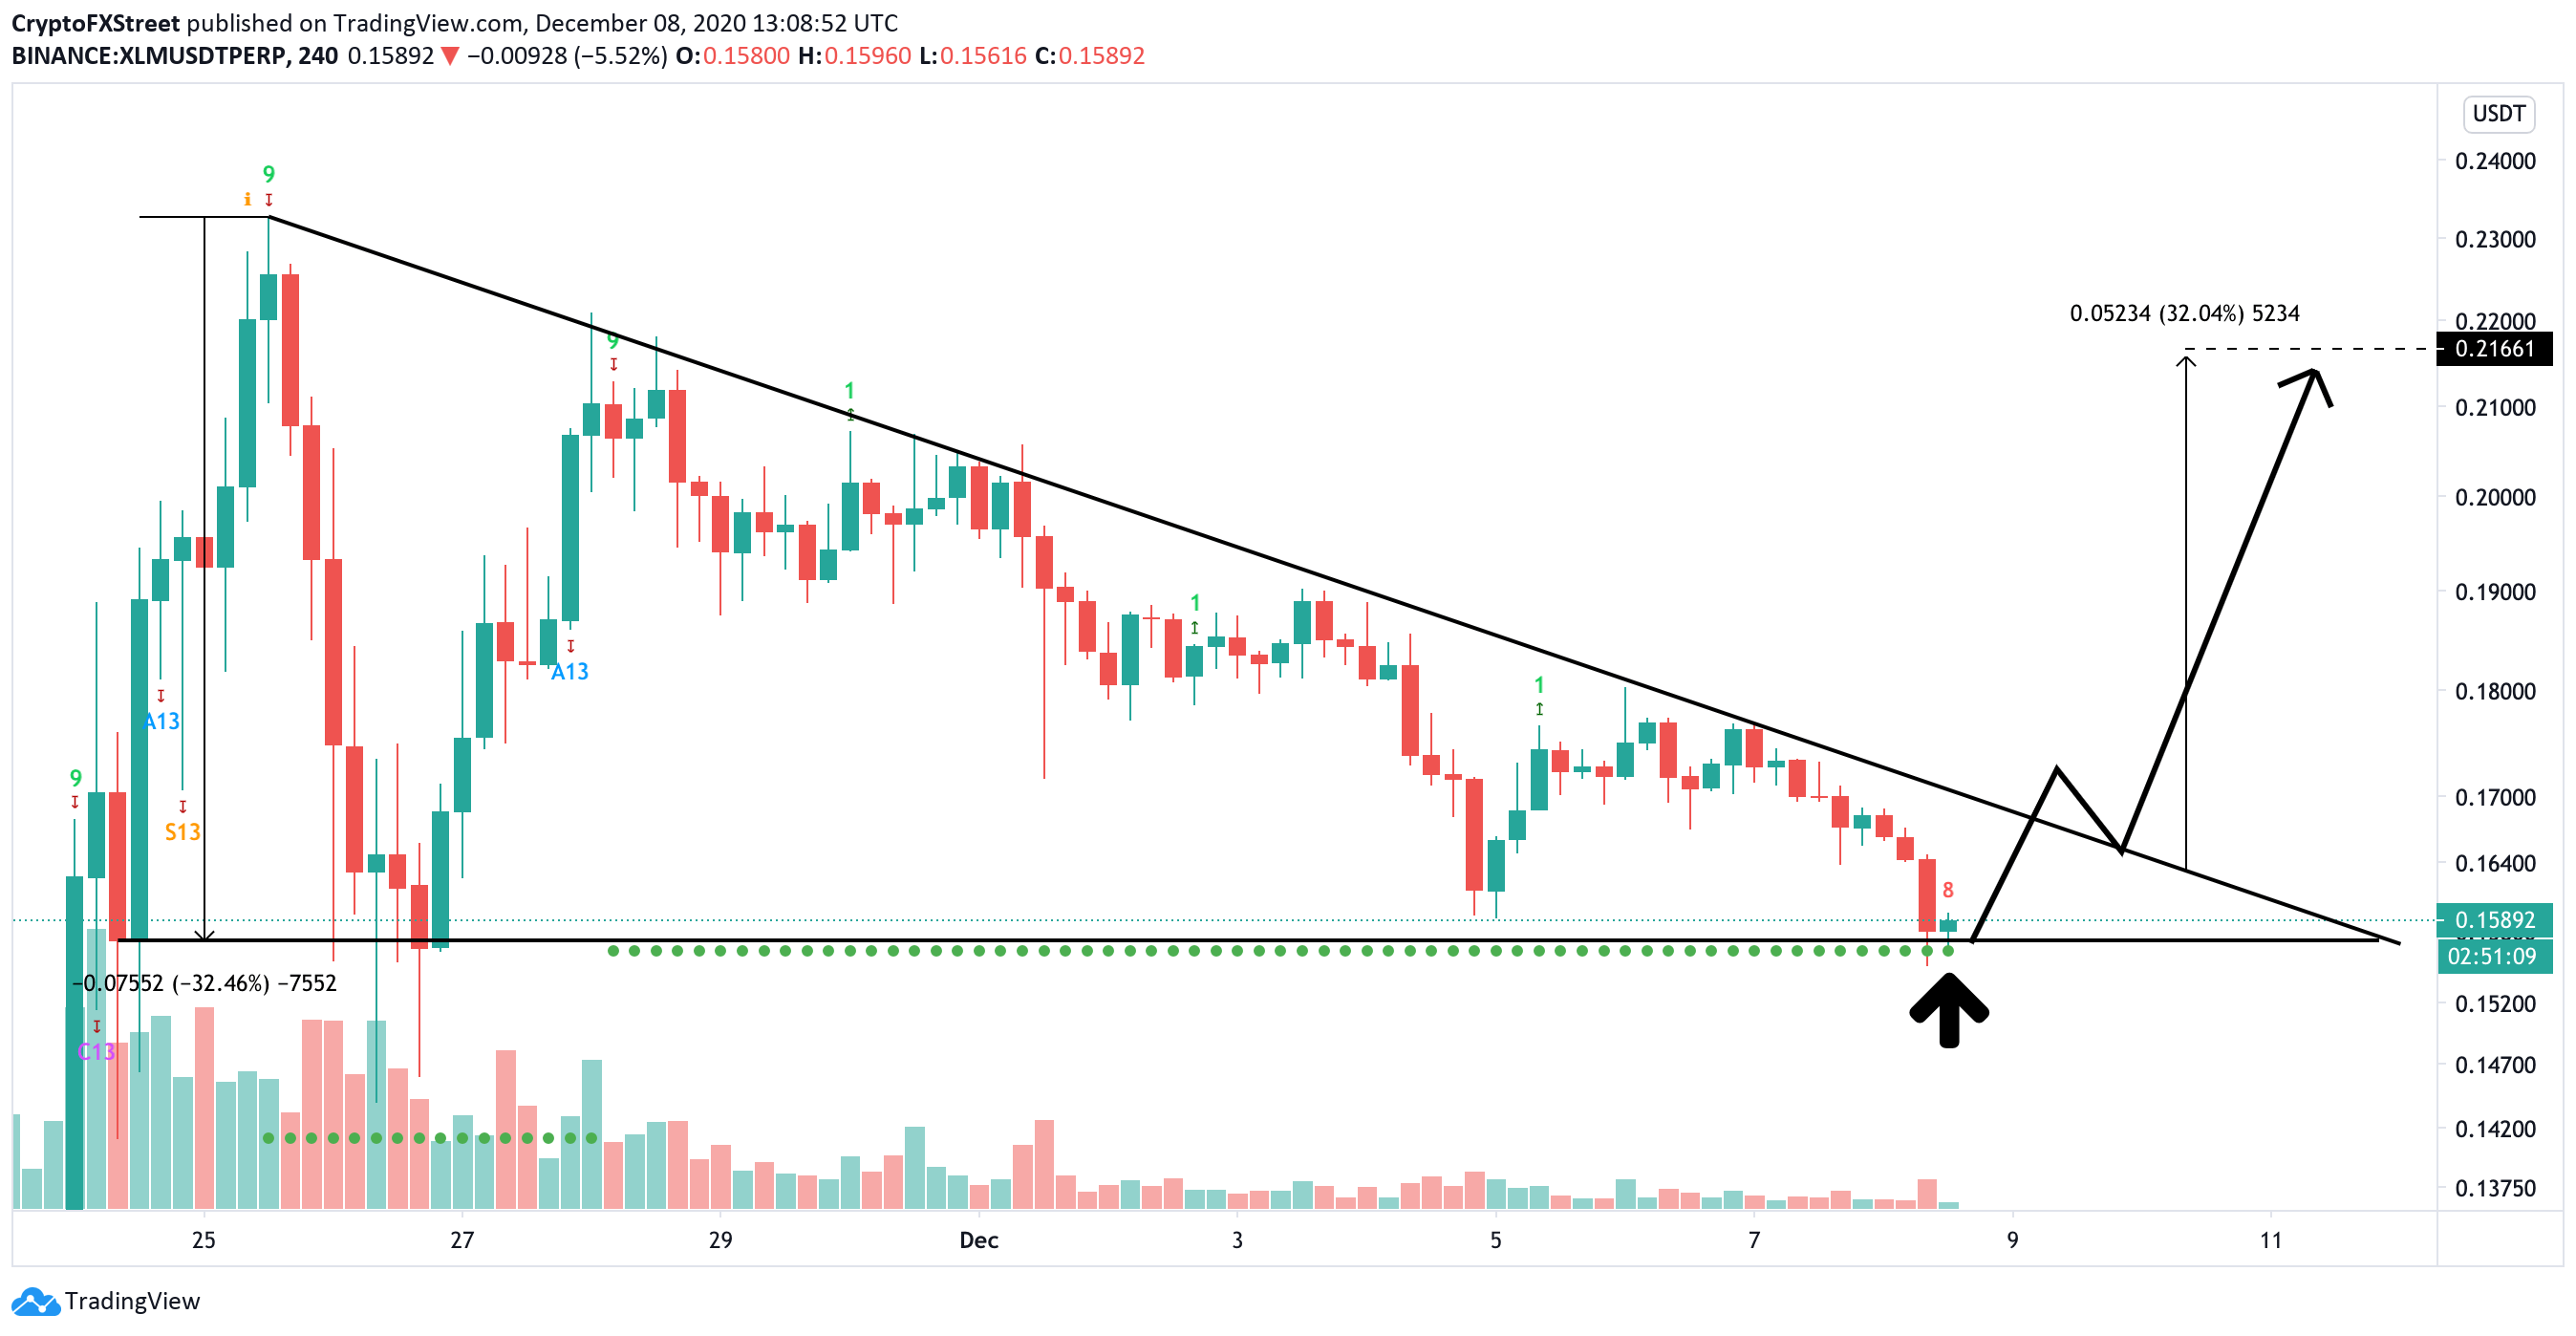
XLM, 4-hour chart
At the same time, the TD Sequential indicator on the 4-hour chart is ready to produce a buy signal. A red nine candlestick will confirm the buying potential and add credibility to the bullish scenario.
On the other hand, a sustainable move below the above-said x-axis will invalidate the immediate positive outlook and result in an over 30$ sell-off with an estimated target at $0.1.
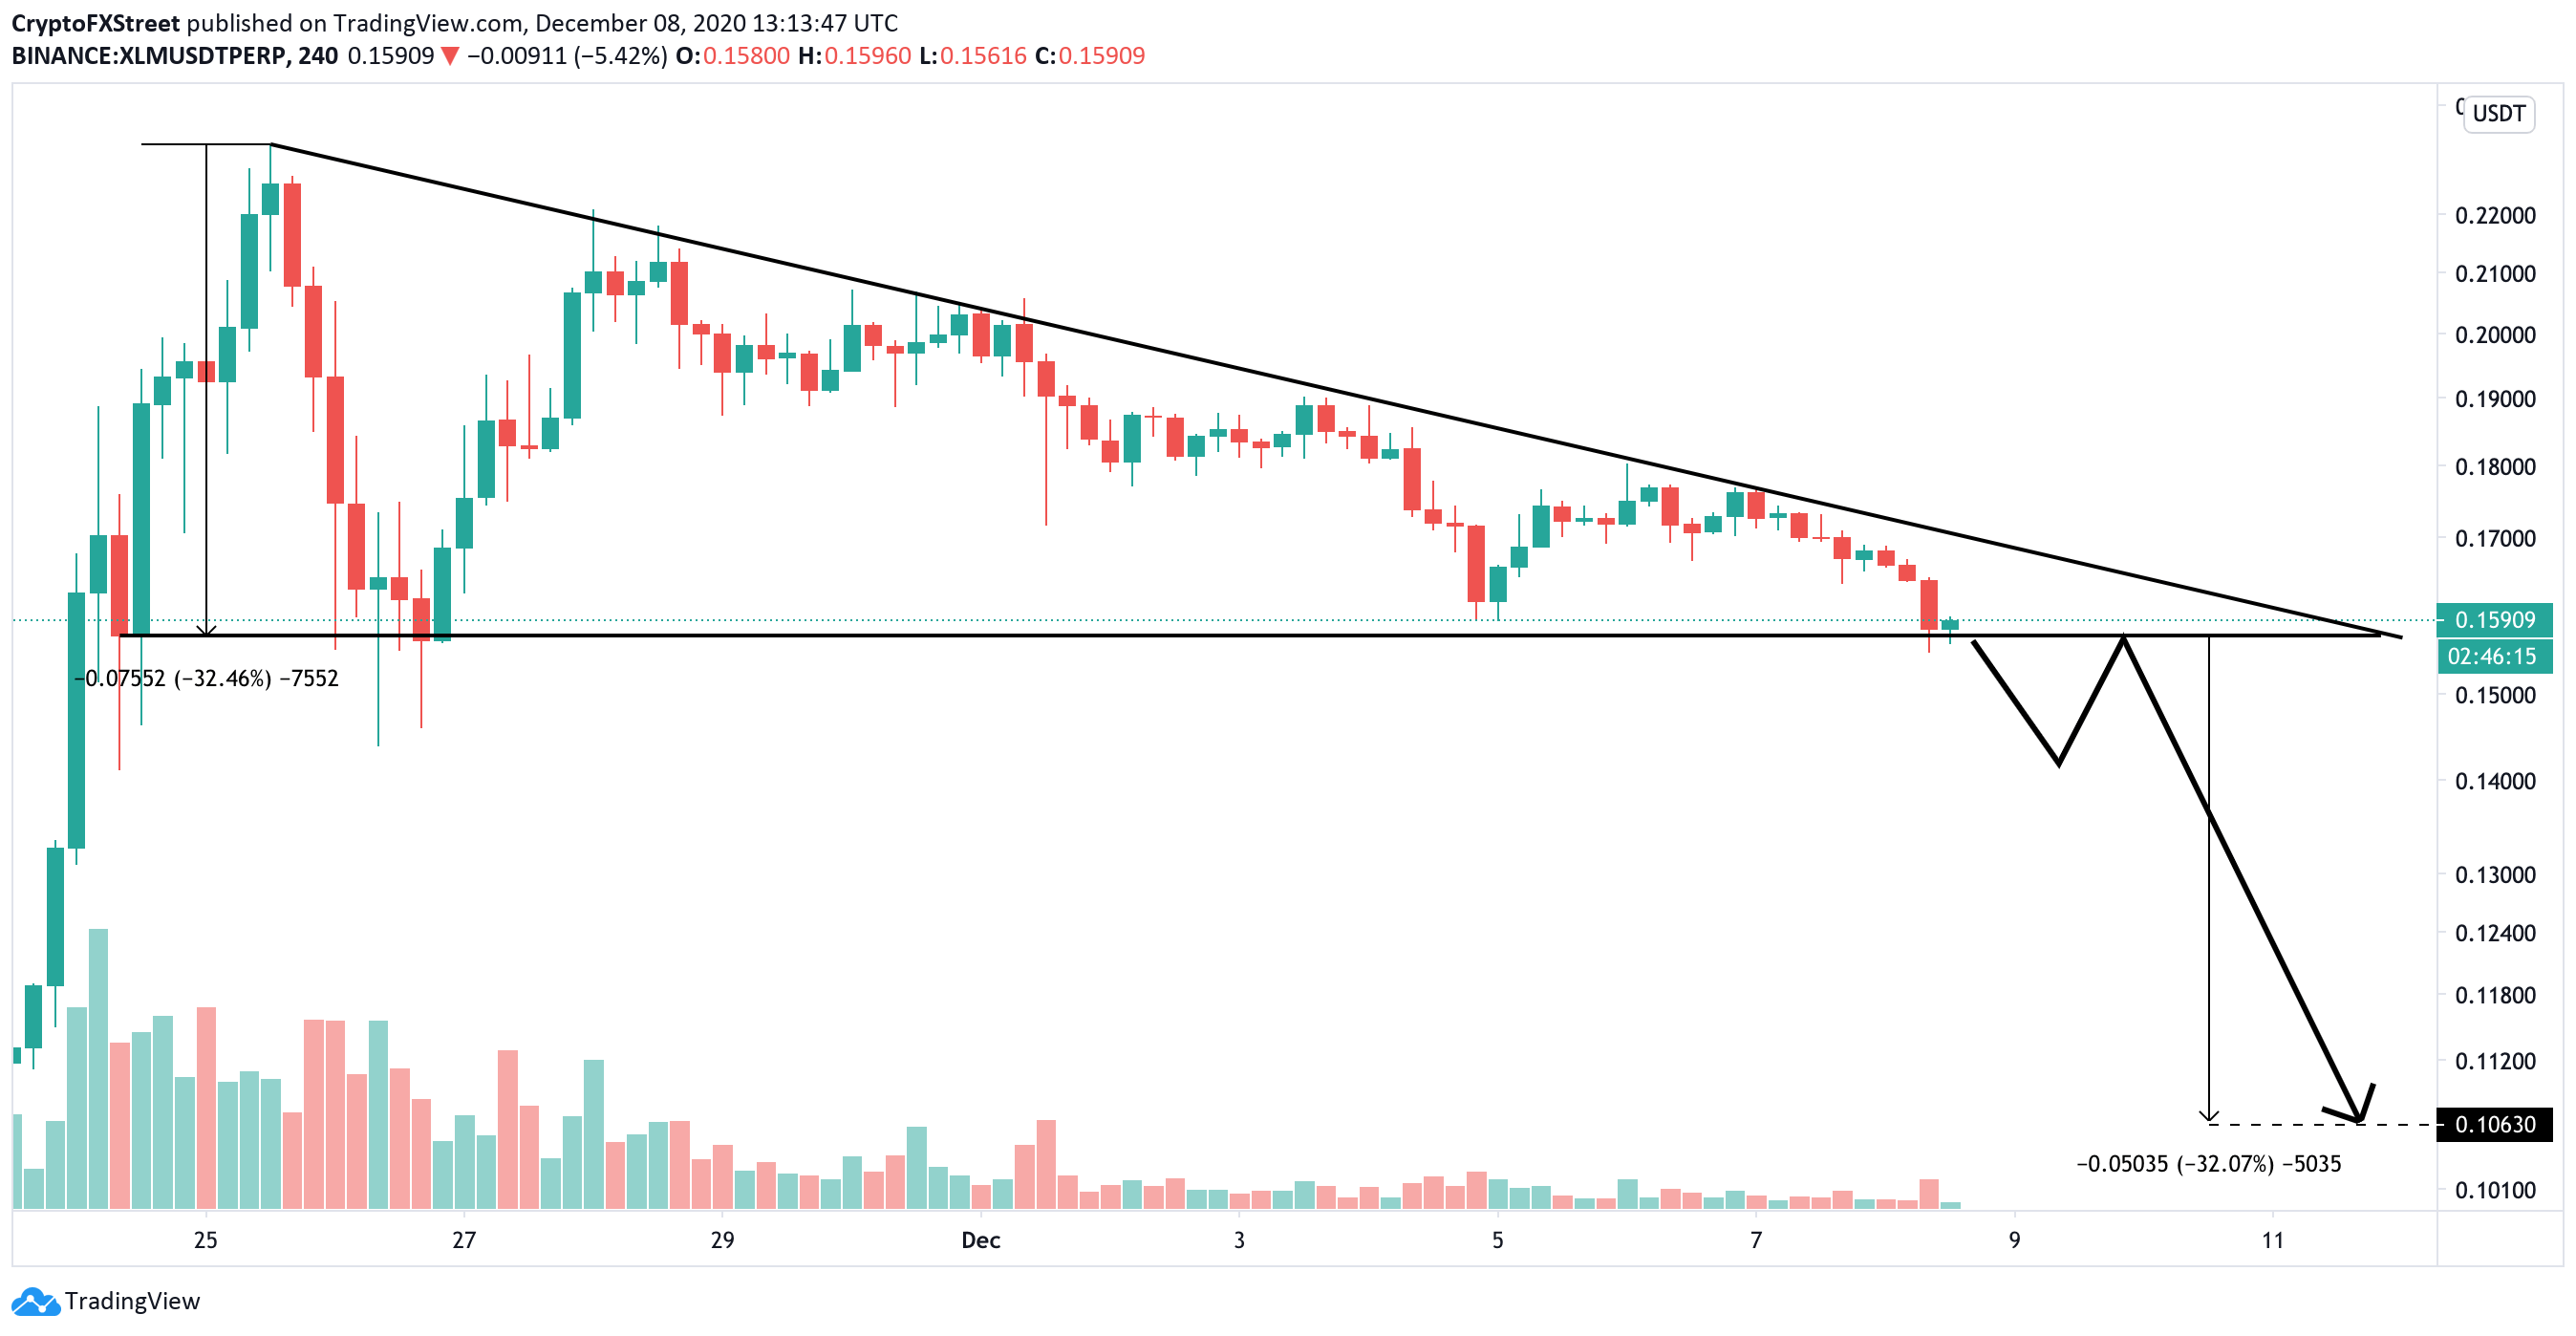
XLM, 4-hour chart
It’s important to note that a descending triangle is a bearish pattern, meaning that the price is likely to go below the support area and extend the decline. However, considering the rebound and a positive signal of TD Sequential indicator, the chances are that the price will eventually go through the sloping trendline at $0.164 and continue the recovery.
