- CHSB/USD has been trading sideways for a few weeks after a massive bull run to $0.173.
- The digital asset has formed a clear and still wide equilibrium pattern.
CHSB had a massive bull rally long before Bitcoin or Ethereum had theirs. The digital asset went from a low of $0.0137 to $0.173 in just two months. Of course, every big rally has a significant consolidation period. CHSB is holding well though at $0.116 and defending daily EMAs.
CHSB/USD daily chart
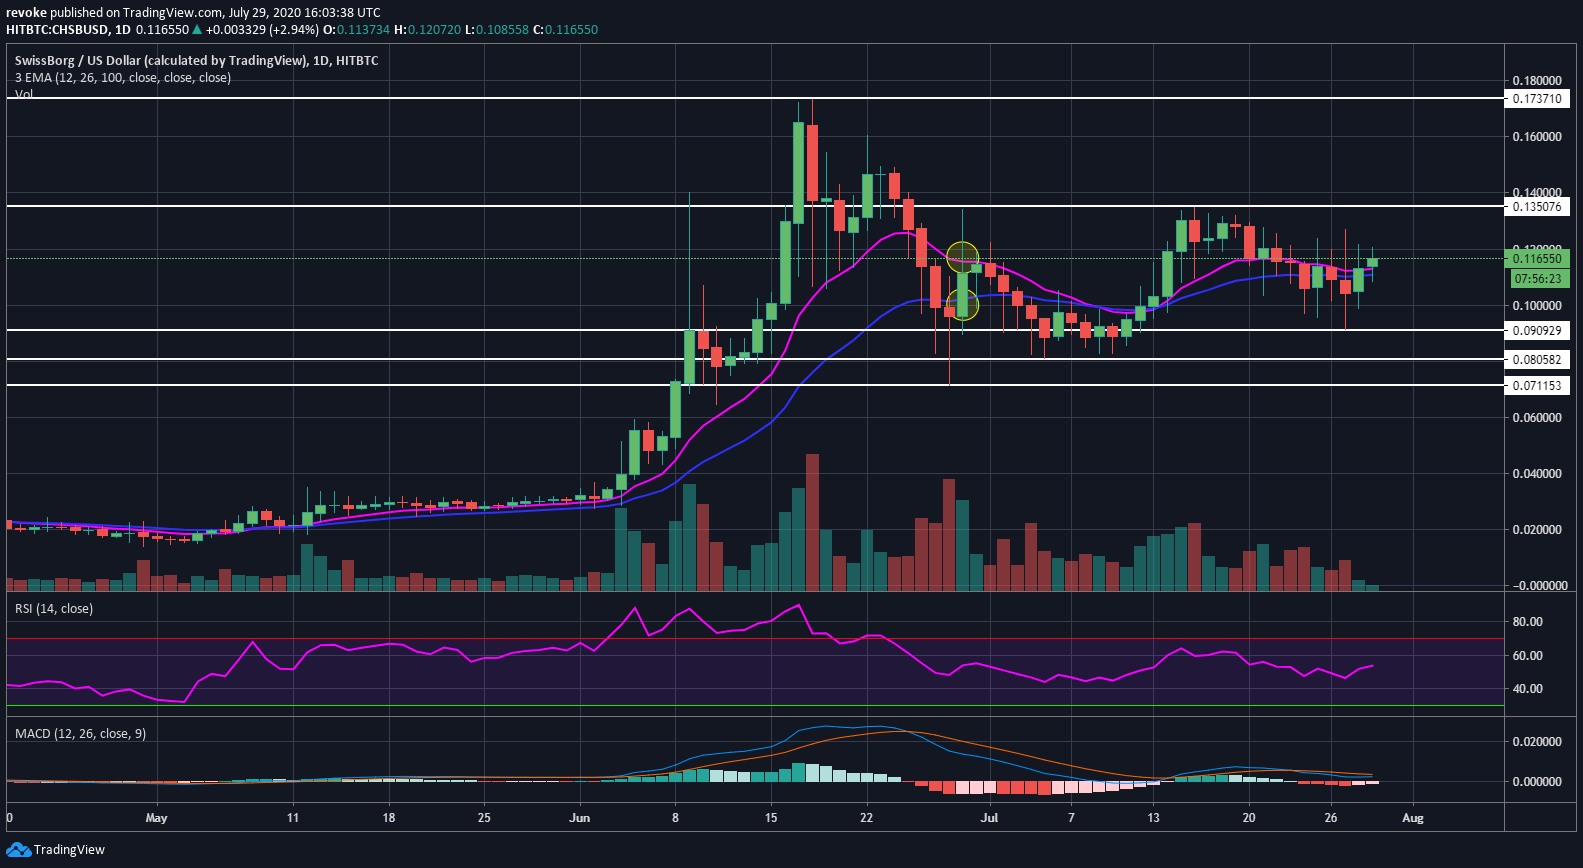
The equilibrium pattern is really apparent with a lower high established at $0.134 and a higher low at $0.091, the break of any of these two levels will lead to a significant breakout. Of course, considering that CHSB is bullish, the entire market is also bullish, buyers have a better chance to see a breakout towards $0.173 and ultimately $0.20 than not.
CHSB/USD weekly chart
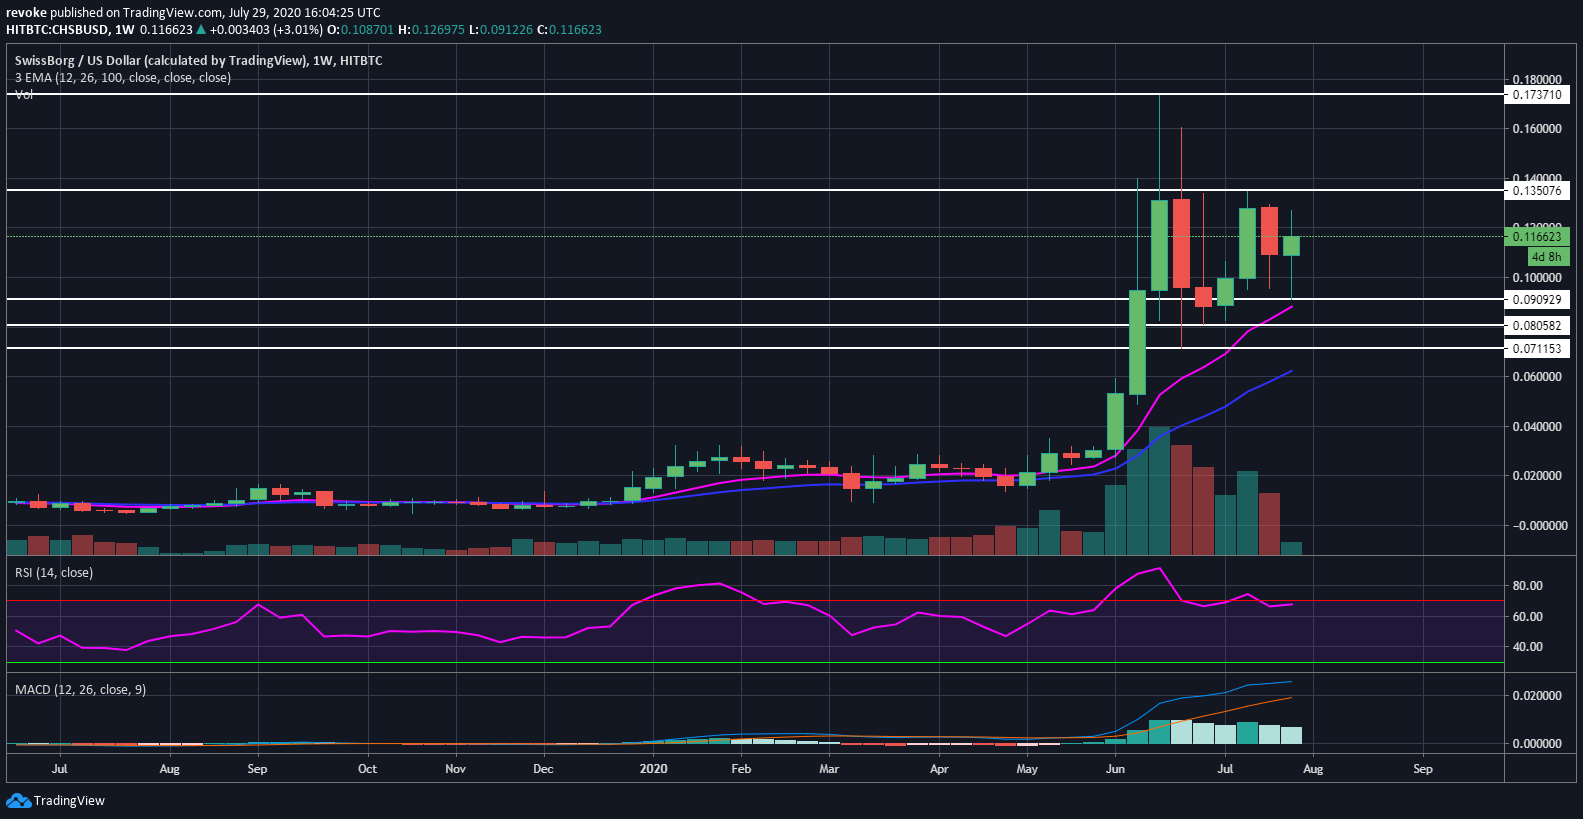
In fact, even on the weekly chart, CHSB is inside an equilibrium pattern. The lower high and higher low are the same here as well which means a break of these levels will certainly produce a massive breakout.
