- Tezos price broke out of a descending triangle pattern on the 12-hour chart.
- Bitcoin hit a new all-time high dragging the market with it.
Tezos broke out of a descending triangle pattern on December 13 and has seen a lot of continuation in the past 24 hours, mostly thanks to Bitcoin’s bullish action. The digital asset aims to hit $2.7 in the long-term.
Tezos price faces very little resistance on its way to $2.7
The breakout of the descending triangle pattern on the 12-hour chart gives bulls a price target of $2.7. Bitcoin finally managed to crack the huge resistance level at $20,000 for the first time ever and the entire cryptocurrency market turned bullish.
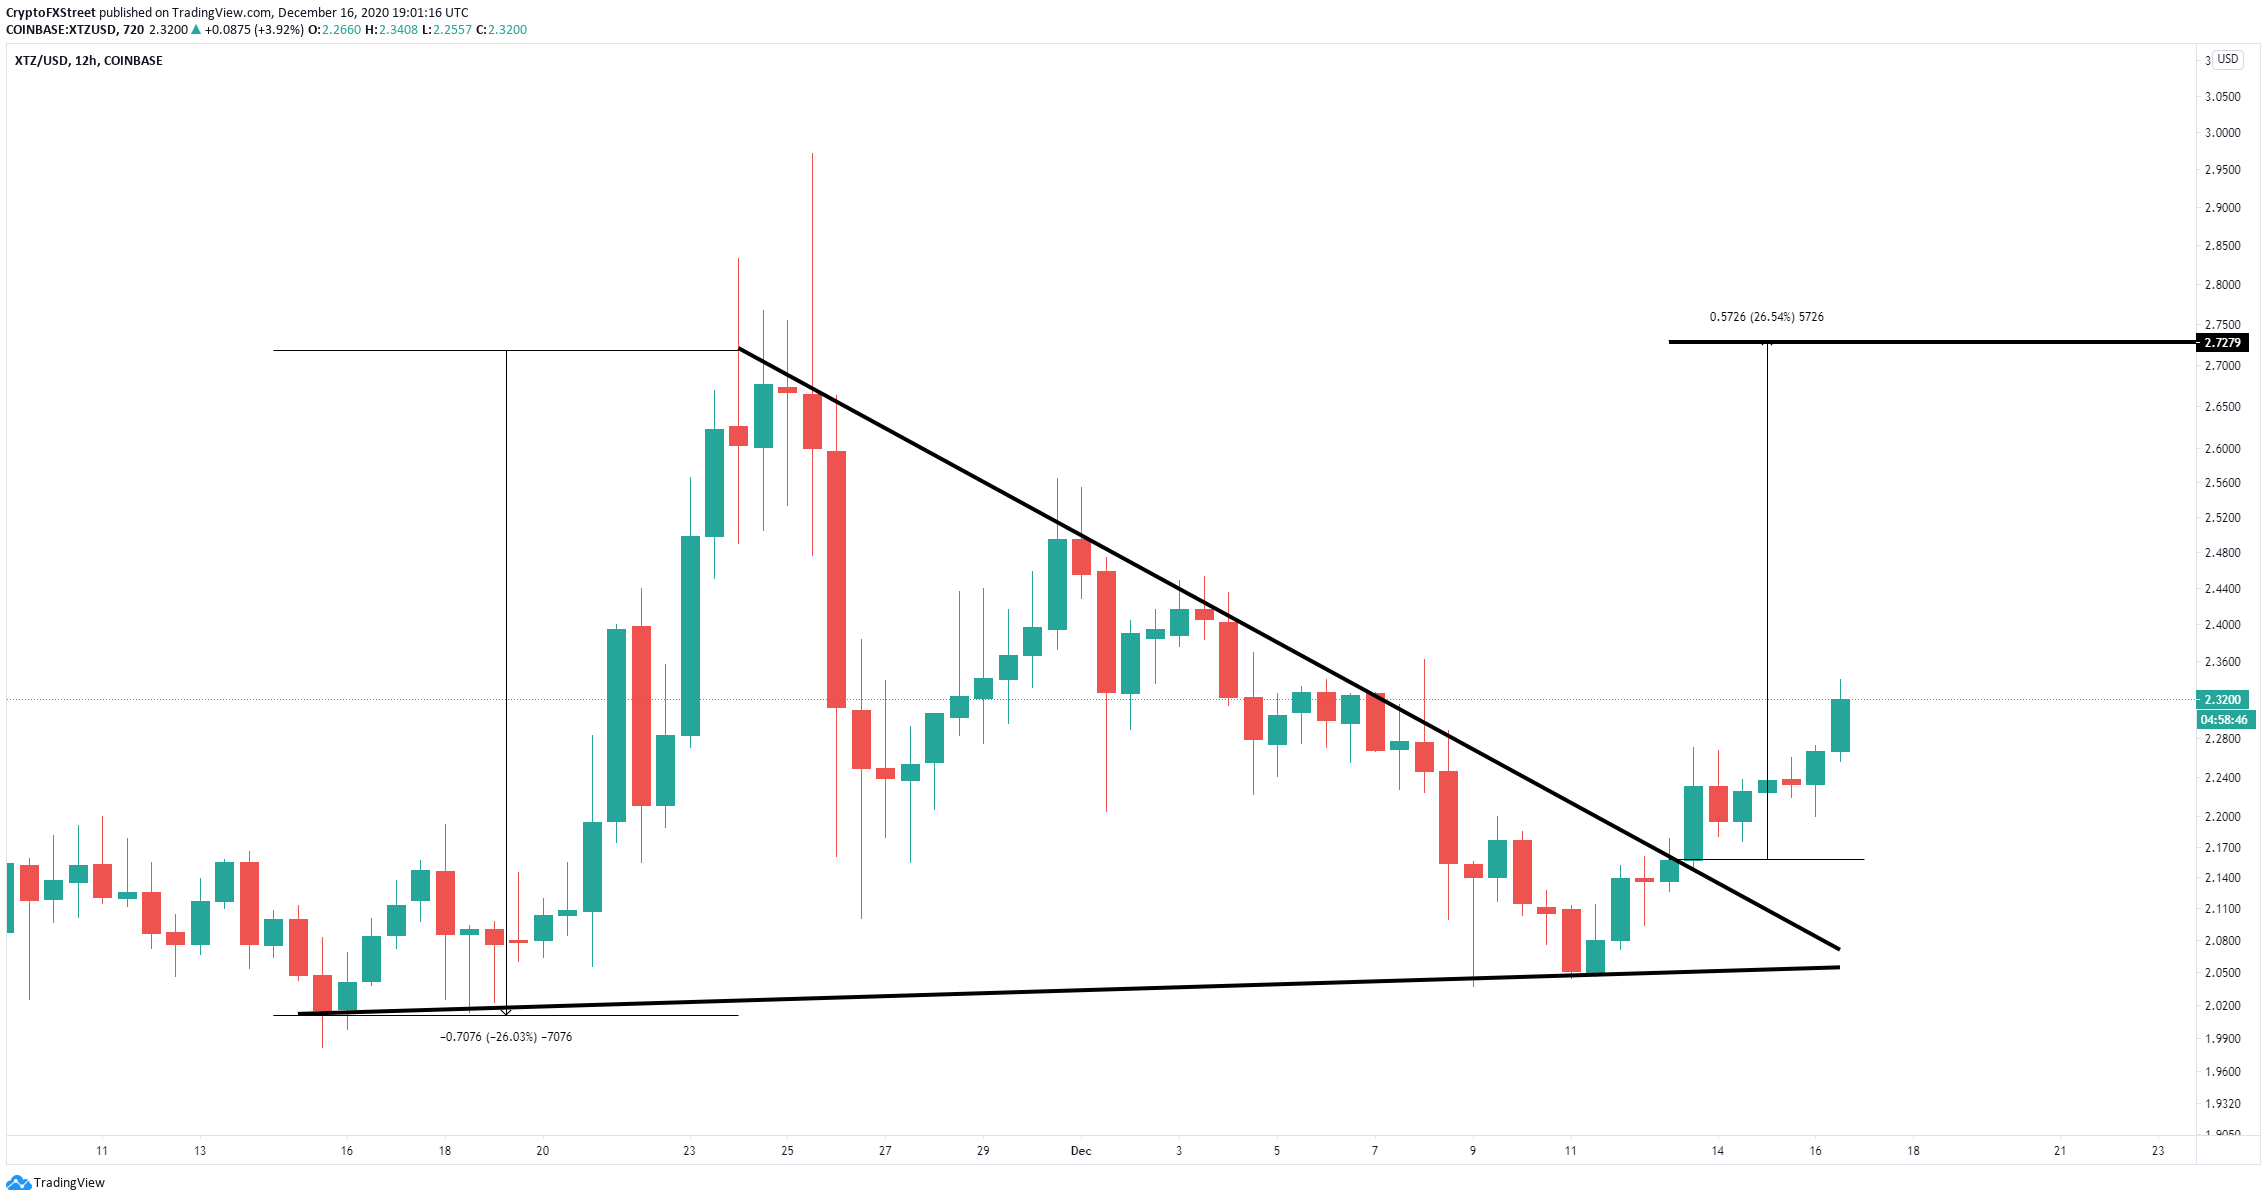
XTZ/USD 12-hour chart
Tezos also experienced a significant spike in trading volume in the past 24 hours which indicates the bullish breakout has a lot of strength. However, there are some short-term bearish signs.
%20%5B20.02.41,%2016%20Dec,%202020%5D-637437423424829626.png)
XTZ Trading Volume chart
On the 12-hour chart, the TD Sequential indicator presented a sell signal that can still get validated within the next 24 hours. So far Tezos price has remained above the 26-EMA, which is a strong support level.
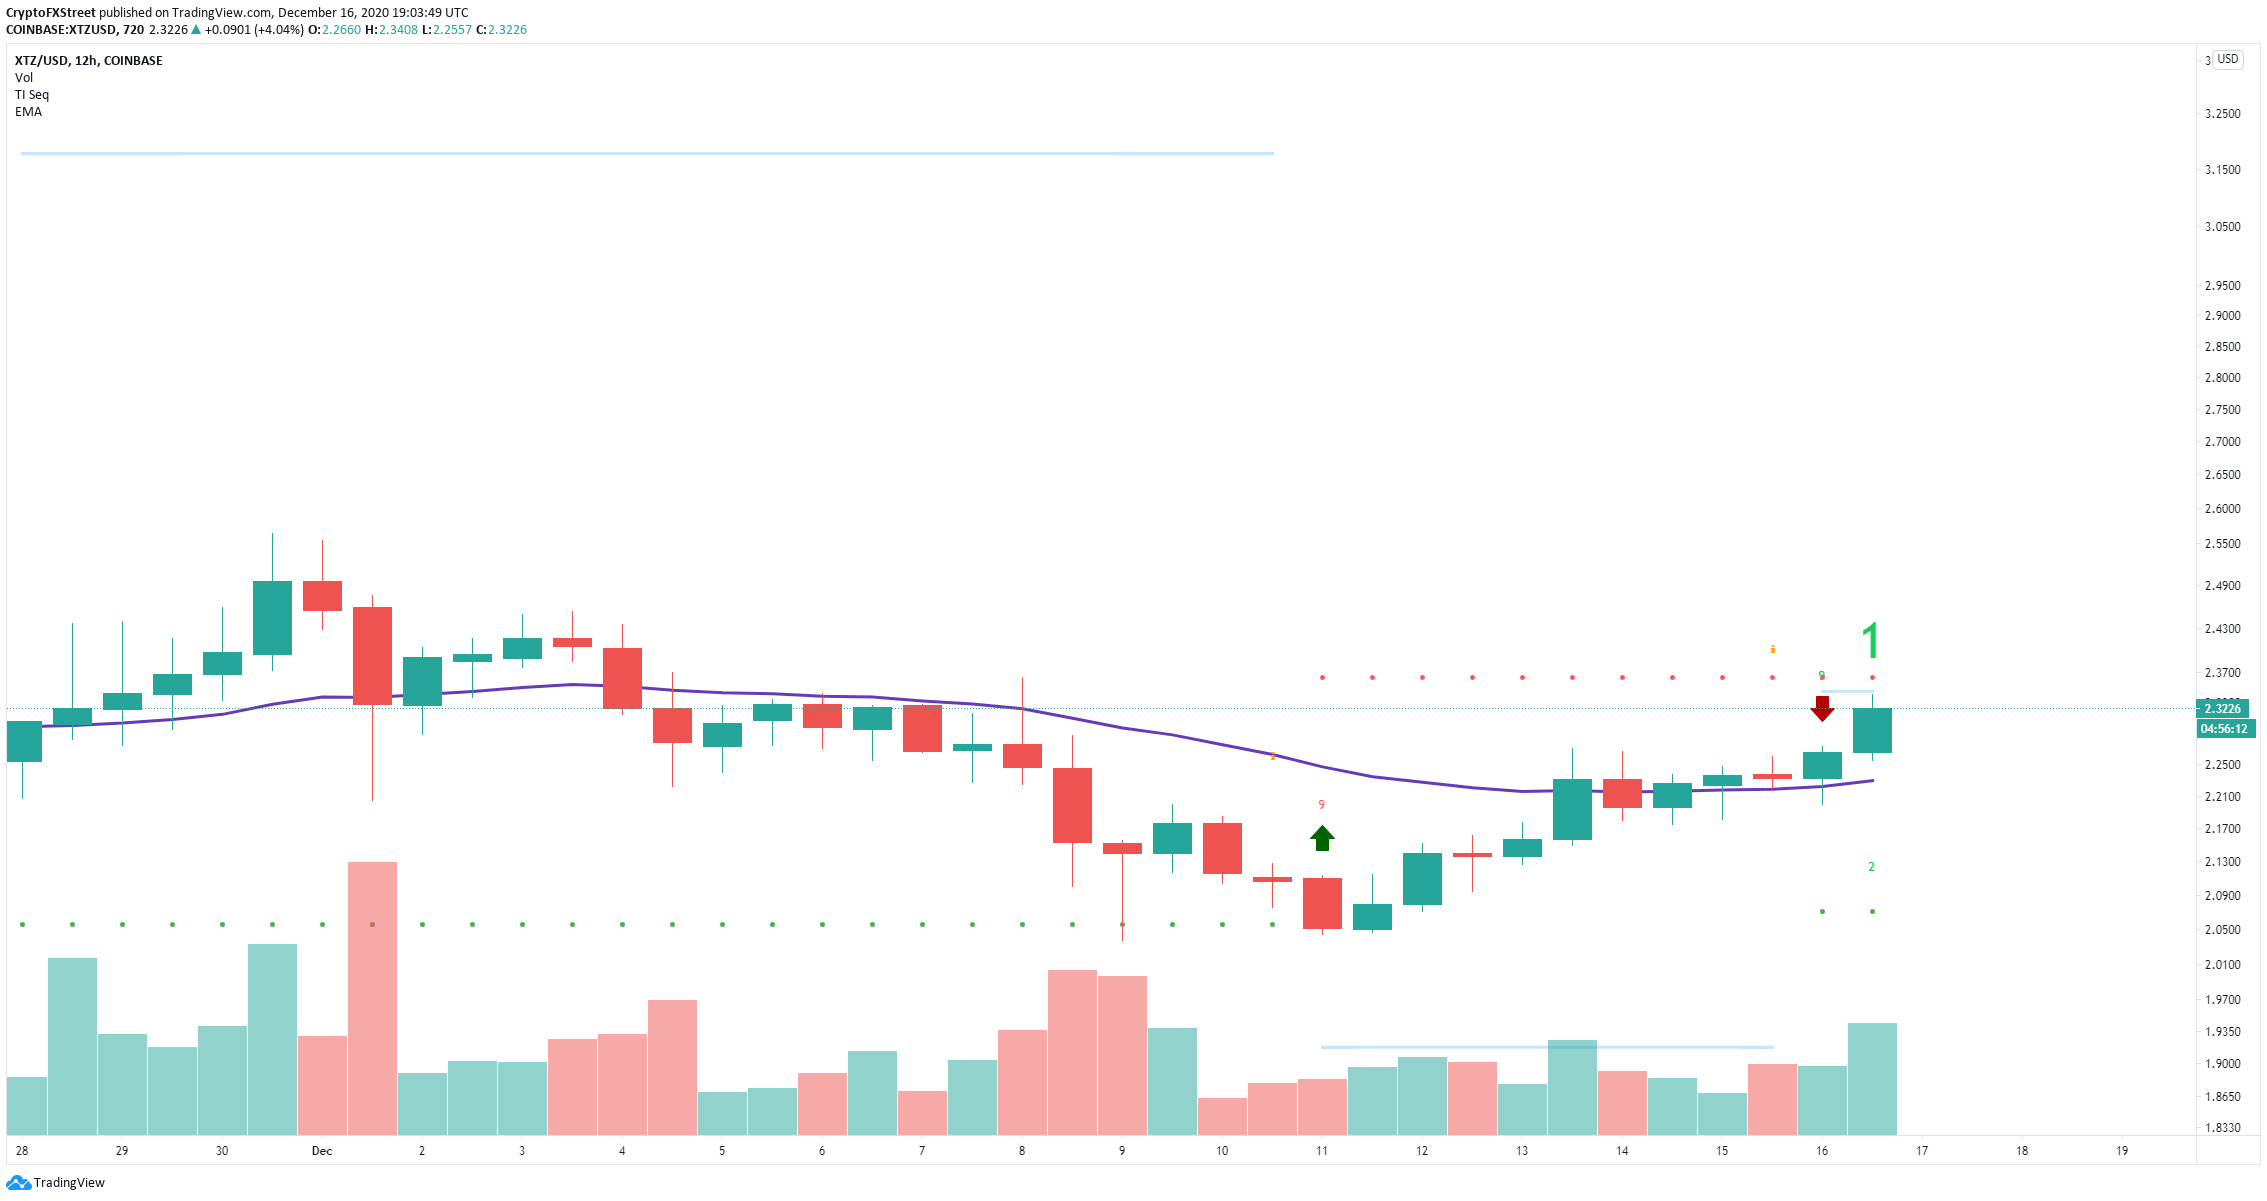
XTZ/USD 12-hour chart
A breakdown below the 26-EMA would be confirmation of the sell signal and can push Tezos price as low as the psychological level at $2 in the longer-term.
