- XTZ/USD finally saw bullish price action following two bearish days.
- The William’s %R was about to enter the oversold zone but has since diverged.
XTZ/USD daily chart
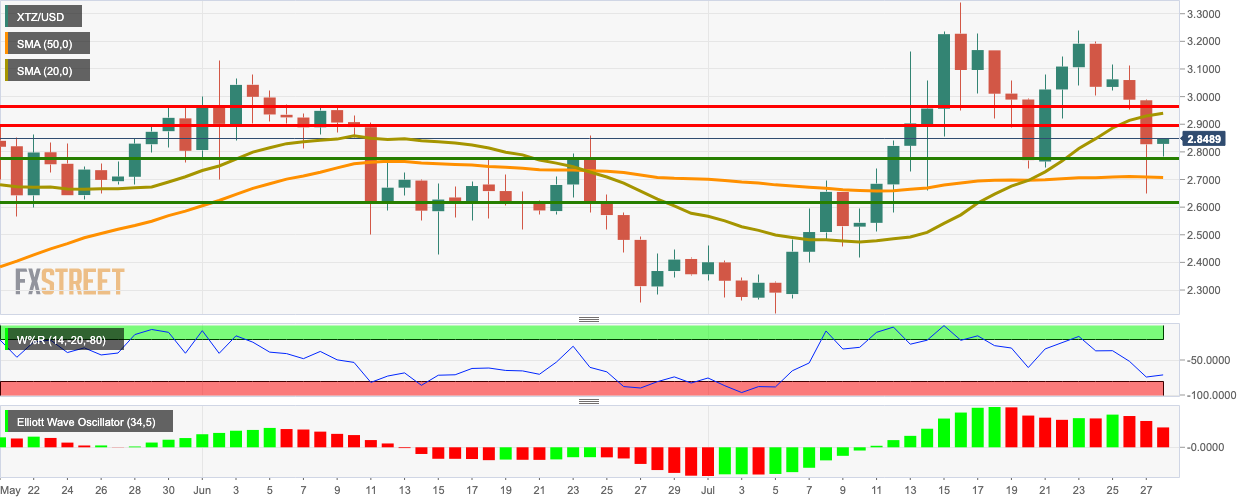
XTZ/USD bulls re-entered the market following two straight bearish days, taking the price up from $2.83 to $2.864. The Elliott Oscillator has had three consecutive red sessions. The William’s %R was about to enter the oversold zone but has since diverged away following bullish price action.
Support and Resistance
XTZ/USD has strong resistance levels at $2.892, $2.94 and $2.97. On the downside, we have healthy support at $2.78, $2.71 (SMA 50) and $2.62.
