- Bitcoin is hovering around the psychological barrier of $19,000.
- At least three technical indicators imply that the coin is on the verge of a massive sell-off.
- A sustainable move above $19,600 will invalidate the bearish scenario.
Bitcoin is changing hands around $19,000. The pioneer digital currency lost over 1% in the past 24 hours; however, it is still in the green zone on a week-to-week basis. BTC celebrated the beginning of the first winter month with a new all-time high at $19,915 and retreated to $18,335 on December 2 amid massive leveraged longs liquidation. Since that time, the coin managed to regain some ground but the bullish momentum is not strong enough to take the price to $20,000 and beyond.
Technical indicators scream sell
From a technical point of view, there are at least three clear signals that promise more pain ahead. The cryptocurrency may continue the downside correction and retest the recent low of $18,335 before another attempt to settle above $19,000 and proceed with the recovery towards ATH.
First, TD Sequential indicator sent a sell signal on the daily chart. The red nine candlestick has transformed into a red one candlestick as the market is on the move. A red two candlestick trading below a preceding red one candle could serve as a confirmation that BTC is poised to drop further for one to four candlesticks with the first target at $18,335, the recent correction bottom. If the selling pressure is strong enough, the pioneer digital coin might start a new downside countdown.
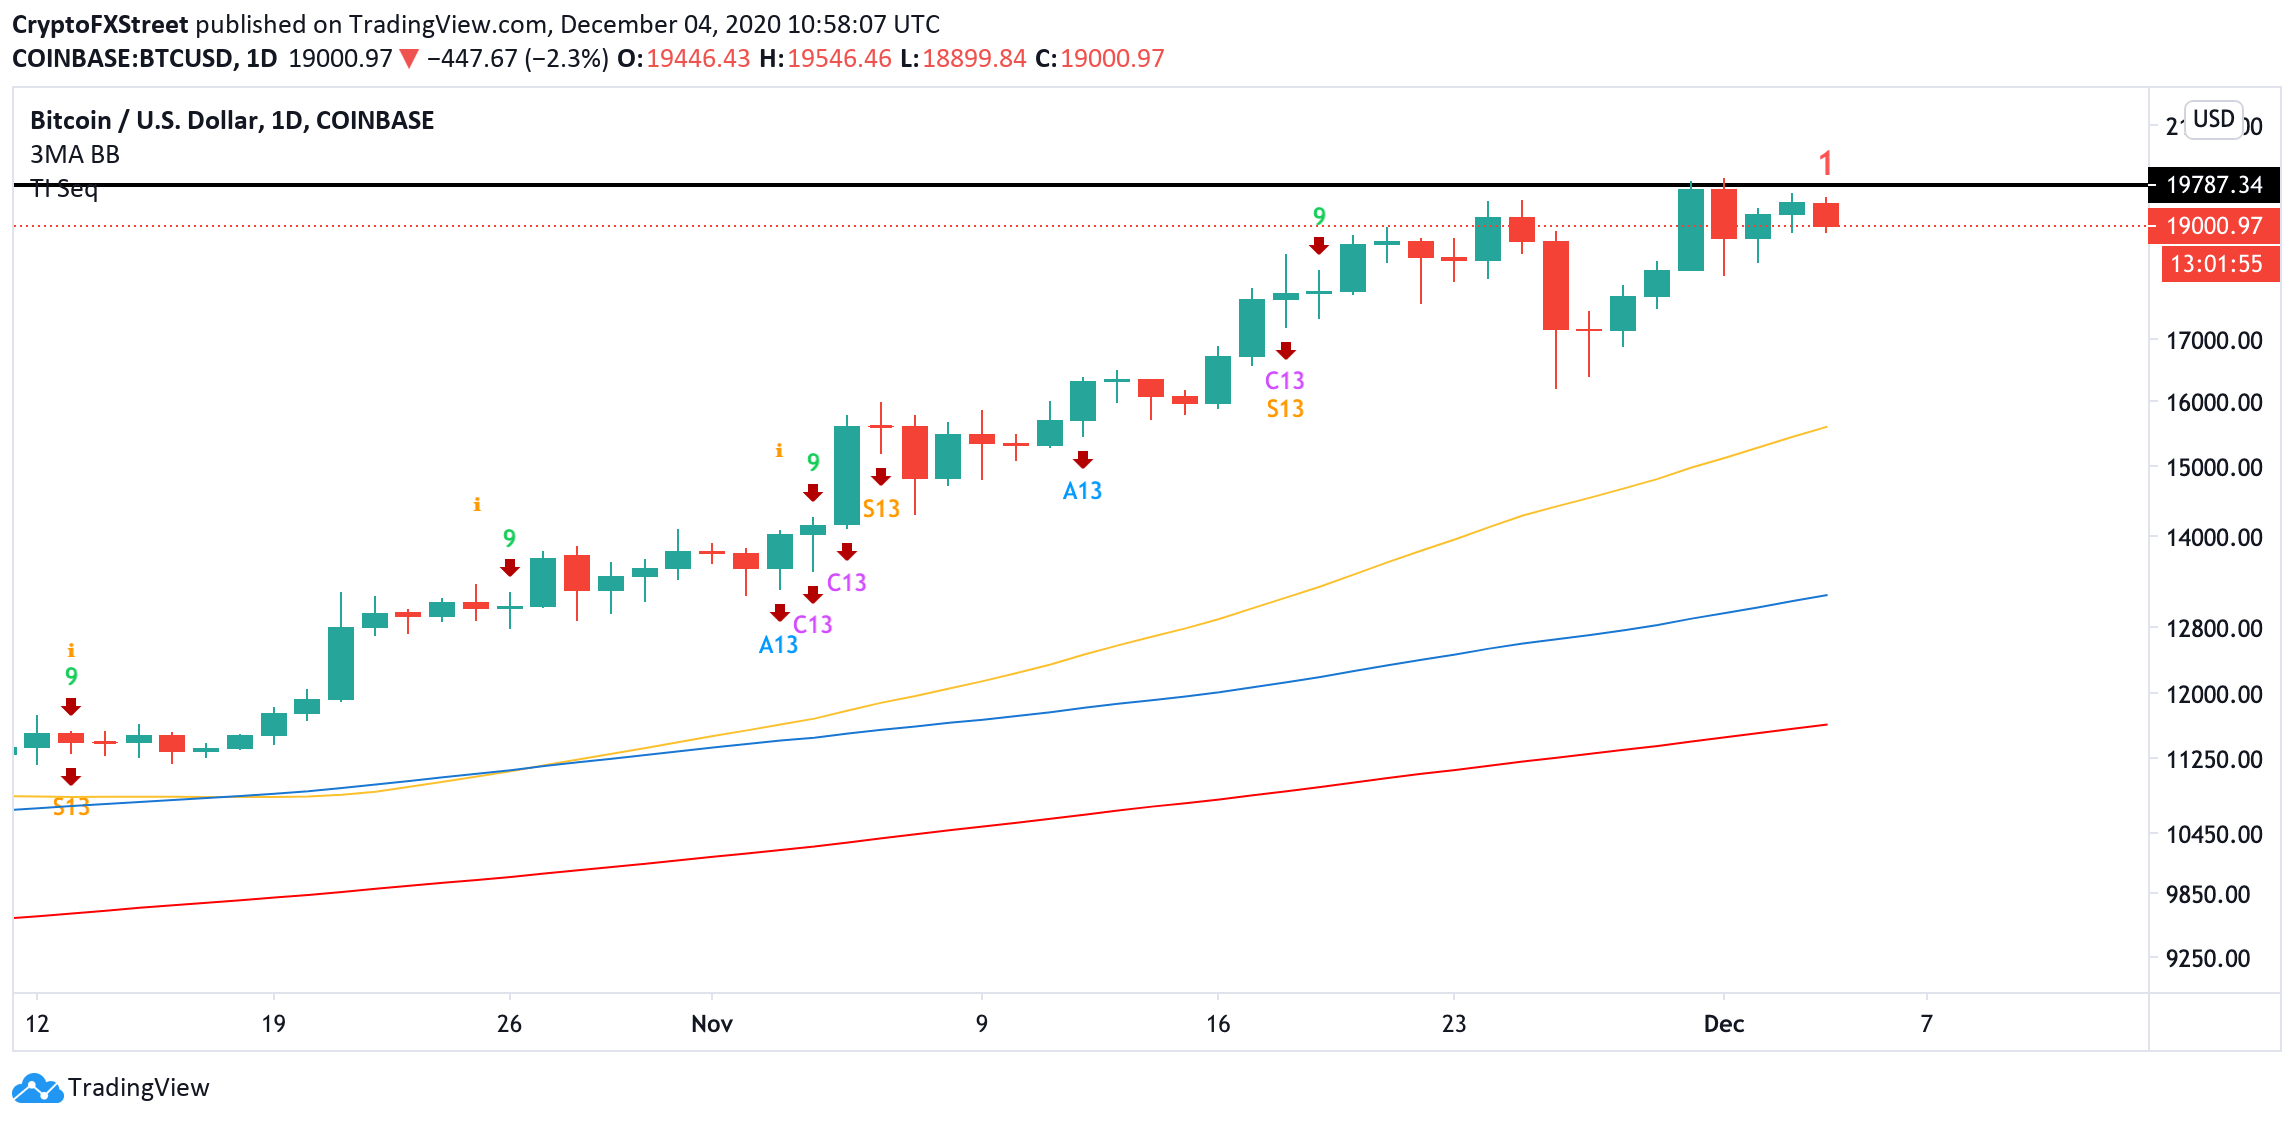
BTC’s daily chart
Second, the Relative Strenght Index (RSI) hit an overbought territory on the weekly chart. A popular crypto Twitter technical analyst, aka Dave the Wave, noted that the indicator exceeded 80, which is usually a precursor for a retreat. His estimated correction price target is $10,000, created by the long-term upside trendline. FXStreet previously reported that 20-30% corrections are typical for BTC long-term bullish trends, meaning that the price may safely retreat to $13,000-$14,000.
Finally, Glassnode’s Percent of Transfer Volume in Profit metric implies that BTC is ready for the correction. This indicator, according to Glassnode, is calculated as a “percentage of transferred coins whose price at the time of their previous movement was lower than the current price.” In other words, it tracks the amount of Bitcoin moved within the chain and is profitable.
Currently, it shows that Bitcoin has created a series of tops, which is a signal of the upcoming correction. Read more details on how it works.
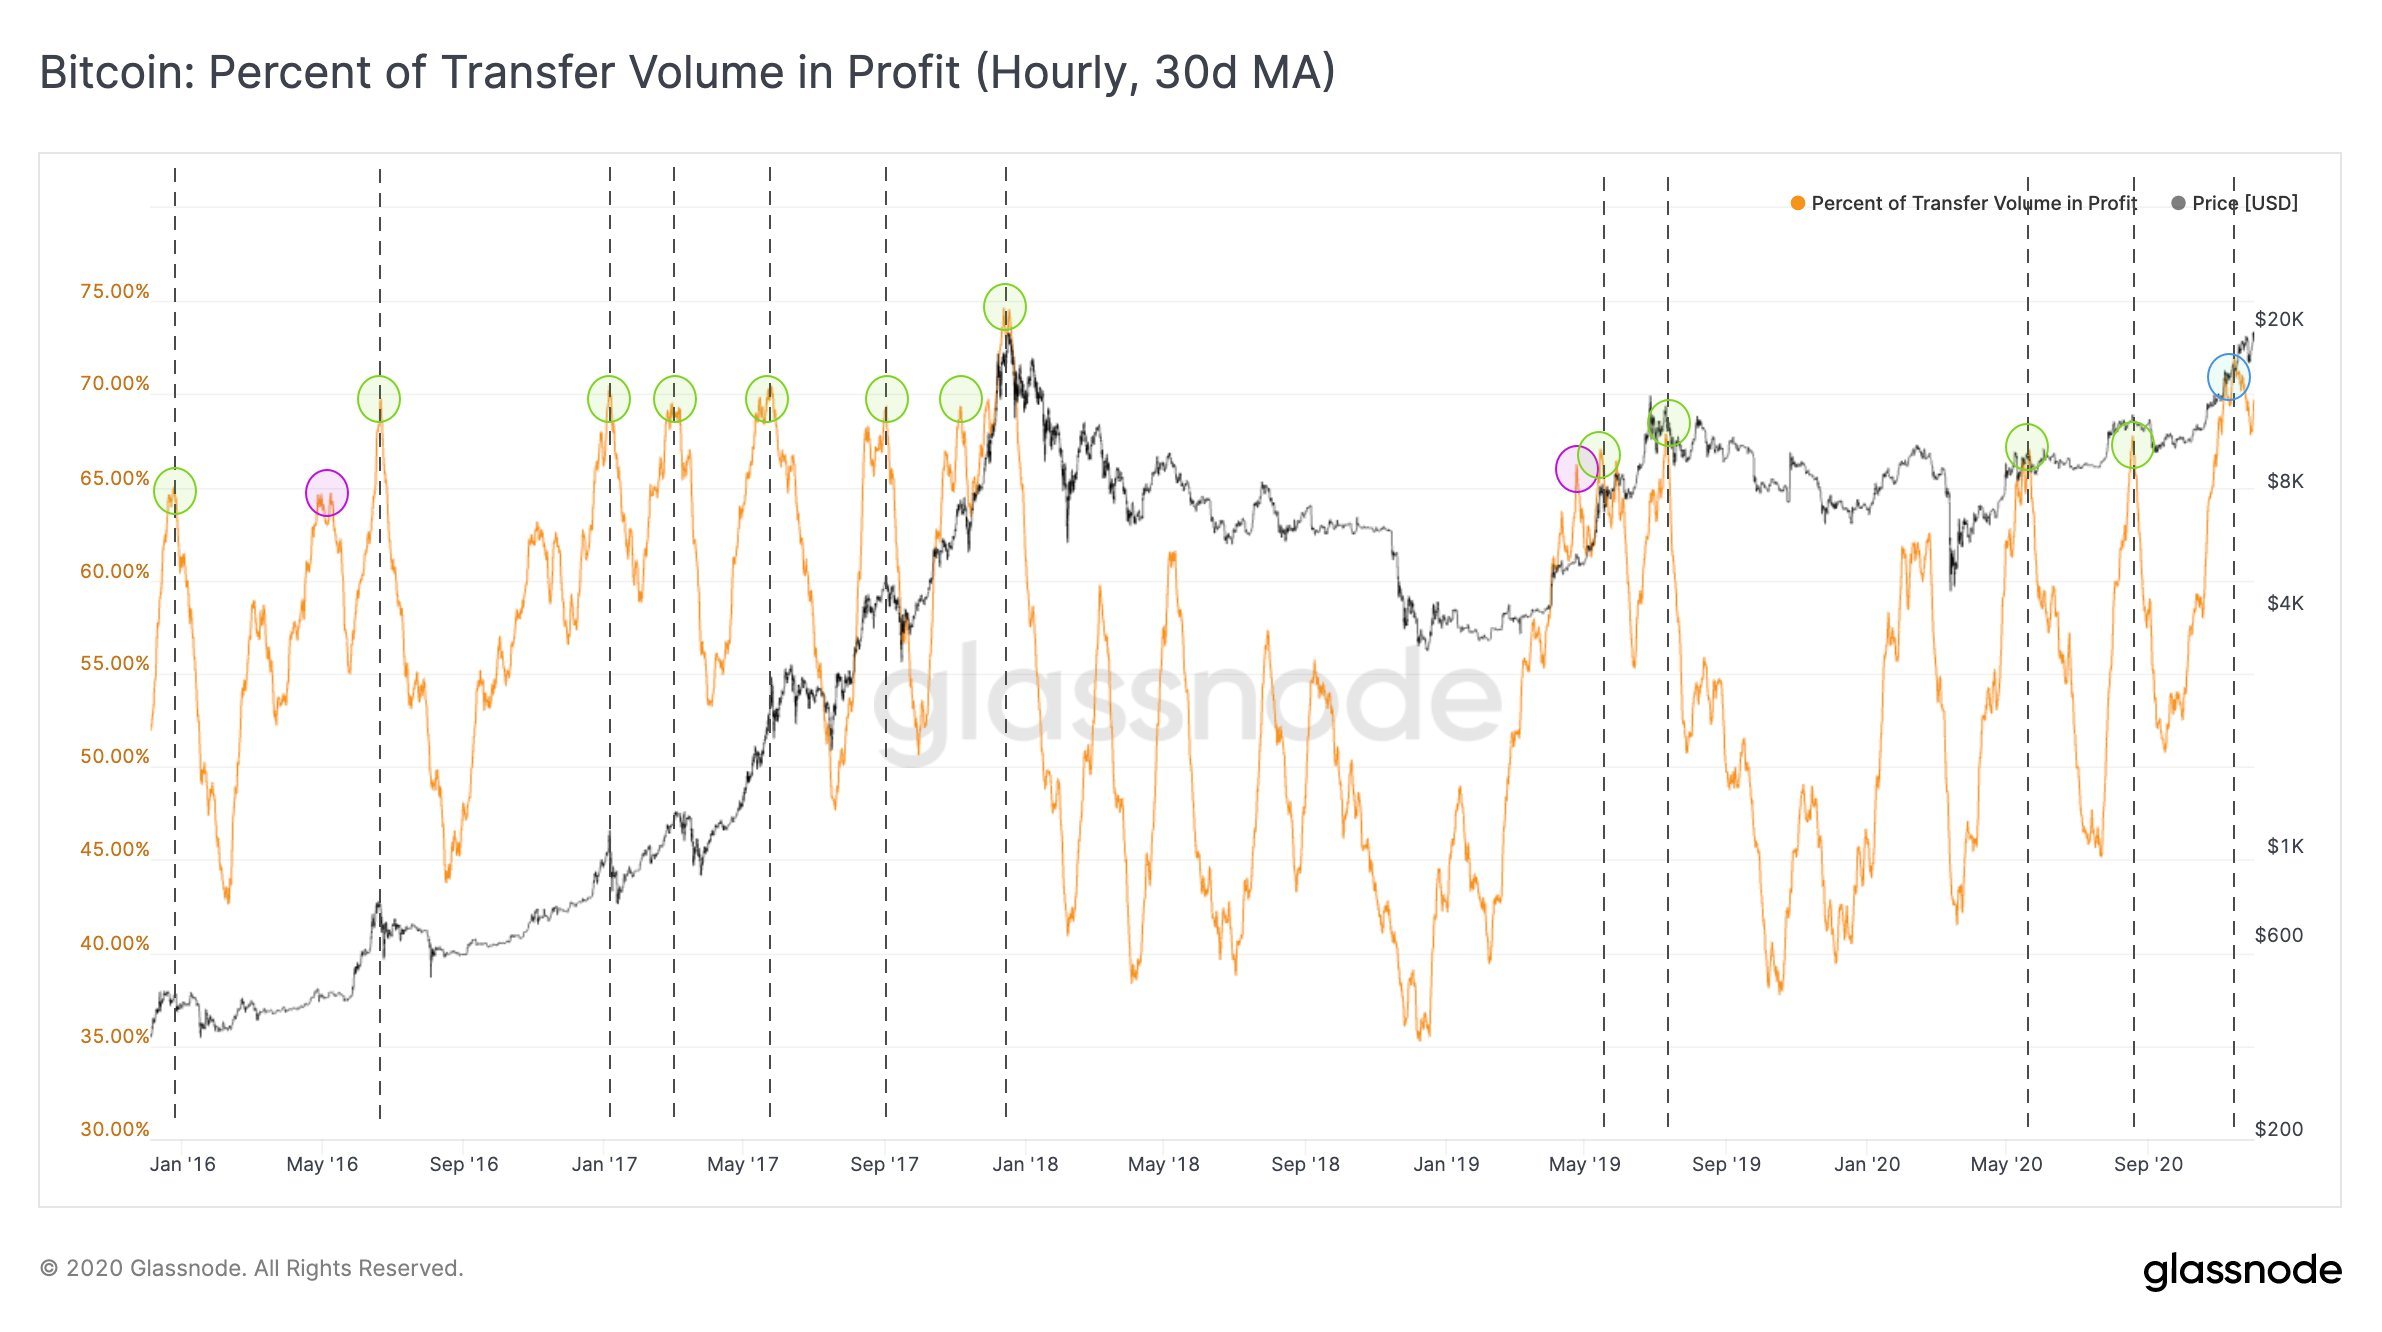
Bitcoin Percent of Transfer Volume in Profit
Key levels to watch
In the long-run, Bitcoin is vulnerable to the deep bearish correction with the first local barrier on approach to $18,000. If it is cleared, the sell orders may start snowballing with the eventual target at $13,000 and, potentially, at $10,000. On the other hand, if the price manages to settle above $19,600, the recent recovery high, the bearish forecast will be invalidated for the time being with the next target at the all-time high.
