- Bitcoin, Ether and XRP hit resistances that separate them from the bullish scenario.
- The current crisis could accelerate the widespread adoption of blockchain technology.
- Gold and top crypto attract money in the face of uncertainty.
This week, two countries have adapted their legislation to make it more friendly to the Blockchain ecosystem and the cryptocurrency market.
South Korea has passed legislation that will allow exchanges to operate in a controlled manner from March 2021. Exchanges will have to keep regulators informed of their activities.
The Supreme Court of India has forced the government to lift its ban on the exchange of cryptocurrencies.
The crypto market is trying to take advantage of tailwinds and has been rising sharply over the last 24 hours, driving the top three assets into significant areas of resistance.
Another demonstration of the renewed interest in the crypto segment is the new Bitcoin mining facility in the US known today. Greenidge Generation, a power generation company that uses Natural Gas, is leveraging its low cost per kWh to achieve 5.5 BTC per day (approx $50K) after installing 7,000 mining rigs.
ETH/BTC Daily Chart
The ETH/BTC pair is currently trading higher in European trading hours at the 0.02596 level after failing to break above 0.026 on the first attempt.
Above the current price, the first resistance level is at 0.0267, then the second at 0.0277 and the third one at 0.0285.
Below the current price, the first support level is at 0.025, then the second at 0.0239 and the third one at 0.022.
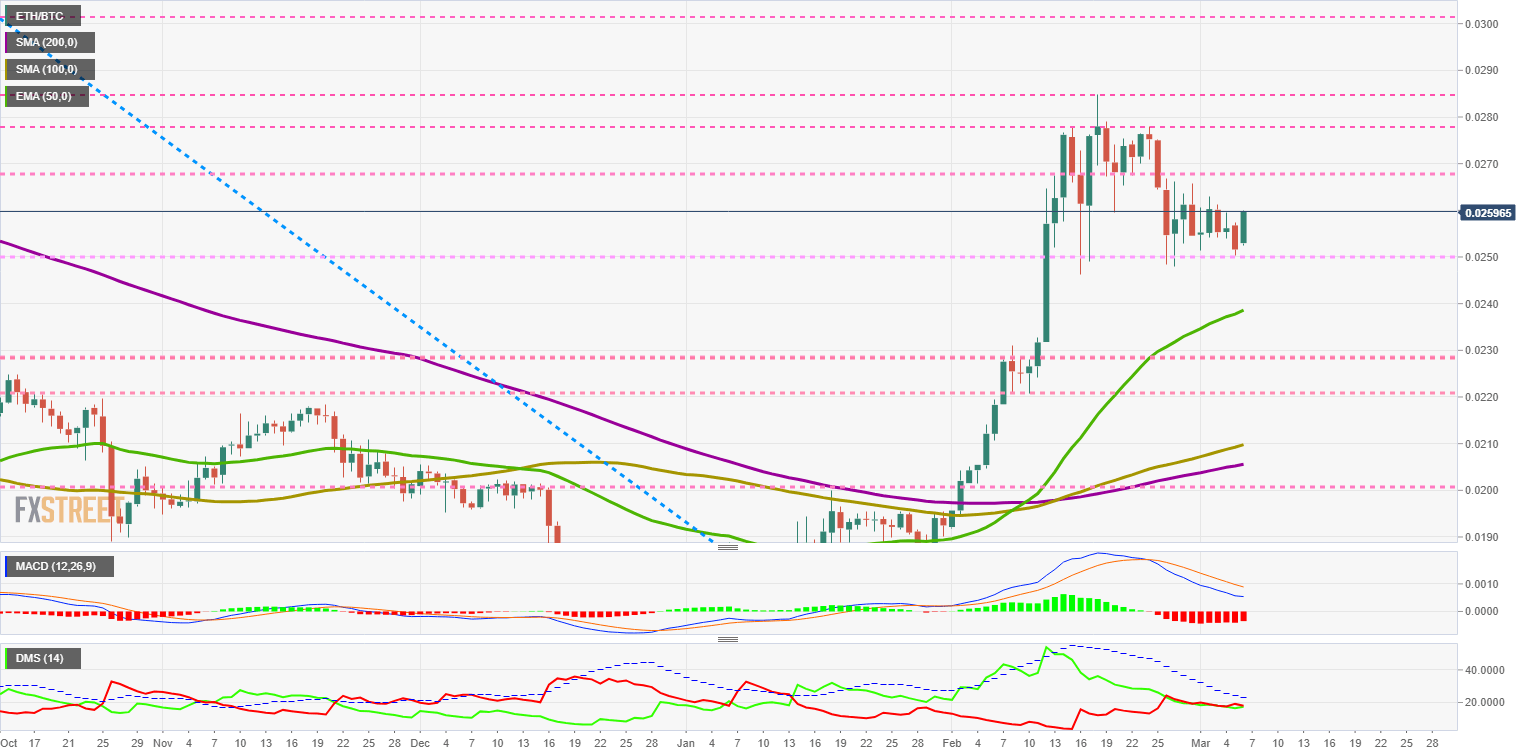 The MACD on the daily chart shows a slight upward correction to the current downward trend. There is not enough data to go into the future.
The DMI on the daily chart shows that the ETH/BTC pair is still in equilibrium. The proximity of the ADX line favours a possible breakout movement from either side of the market.
BTC/USD Daily Chart
The BTC/USD pair is currently trading at the price level of $9126.8 and continues to hit the resistance level at $9170, which protects the bullish continuity scenario.
Above the current price, the first resistance level is at $9170, then the second at $9650 and the third one at $10240.
Below the current price, the first support level is at $8800, then the second at $8400 and the third one at $8200.
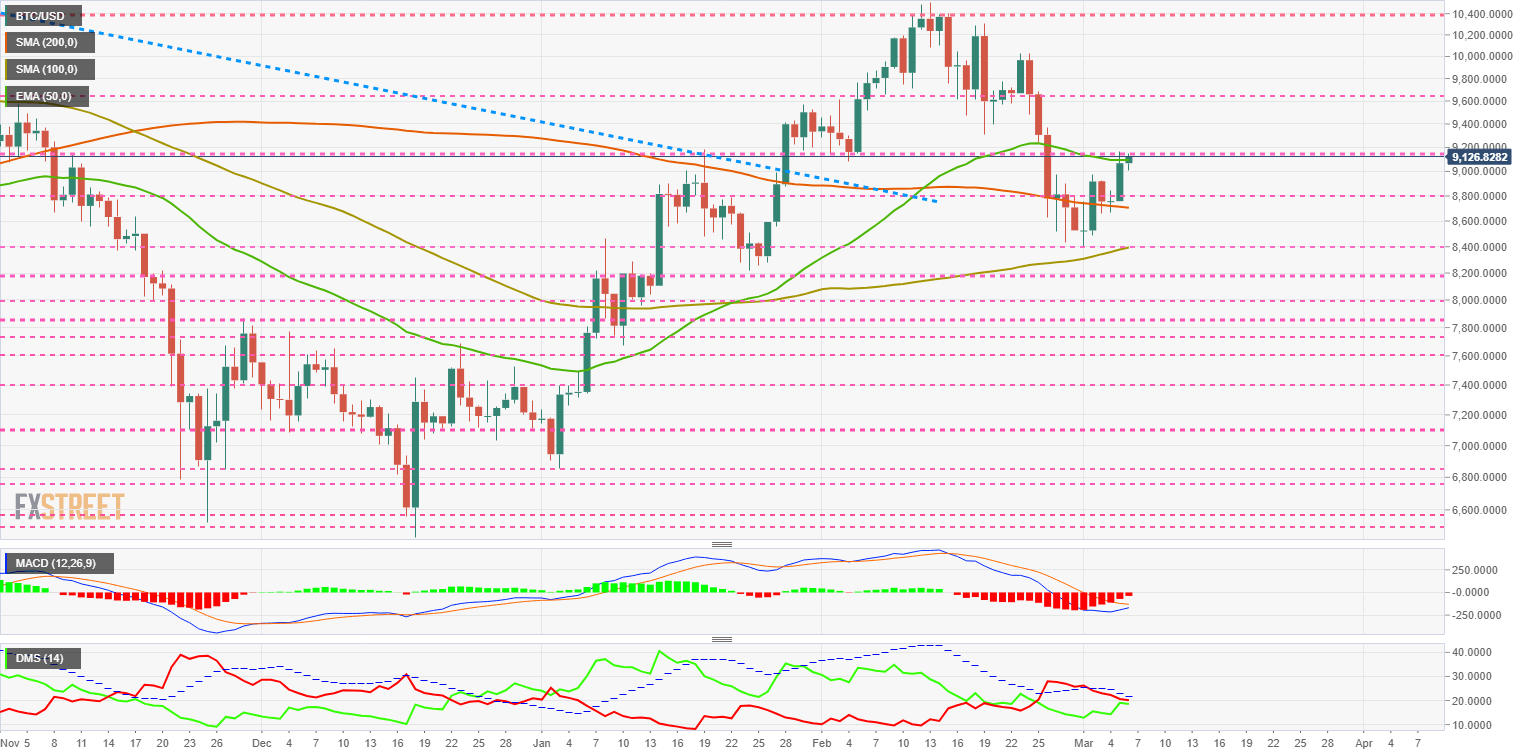 The MACD on the daily chart shows a profile that is conducive to a bullish cross. The probability that a “MACD failure” pattern may be triggered.
The DMI on the daily chart shows how the equilibrium situation seen in the ETH/USD and the XRP/USD pair repeats itself in the BTC/USD area. It is likely that in the case of Bitcoin, this equilibrium will be short-lived.
ETH/USD Daily Chart
The ETH/USD pair is currently trading at the price level of $237 and is just barely breaking through the price congestion resistance at $235.
Above the current price, the first resistance level is at $250, then the second at $260 and the third one at $275.
Below the current price, the first support level is at $235, then the second at $228 and the third one at $215.
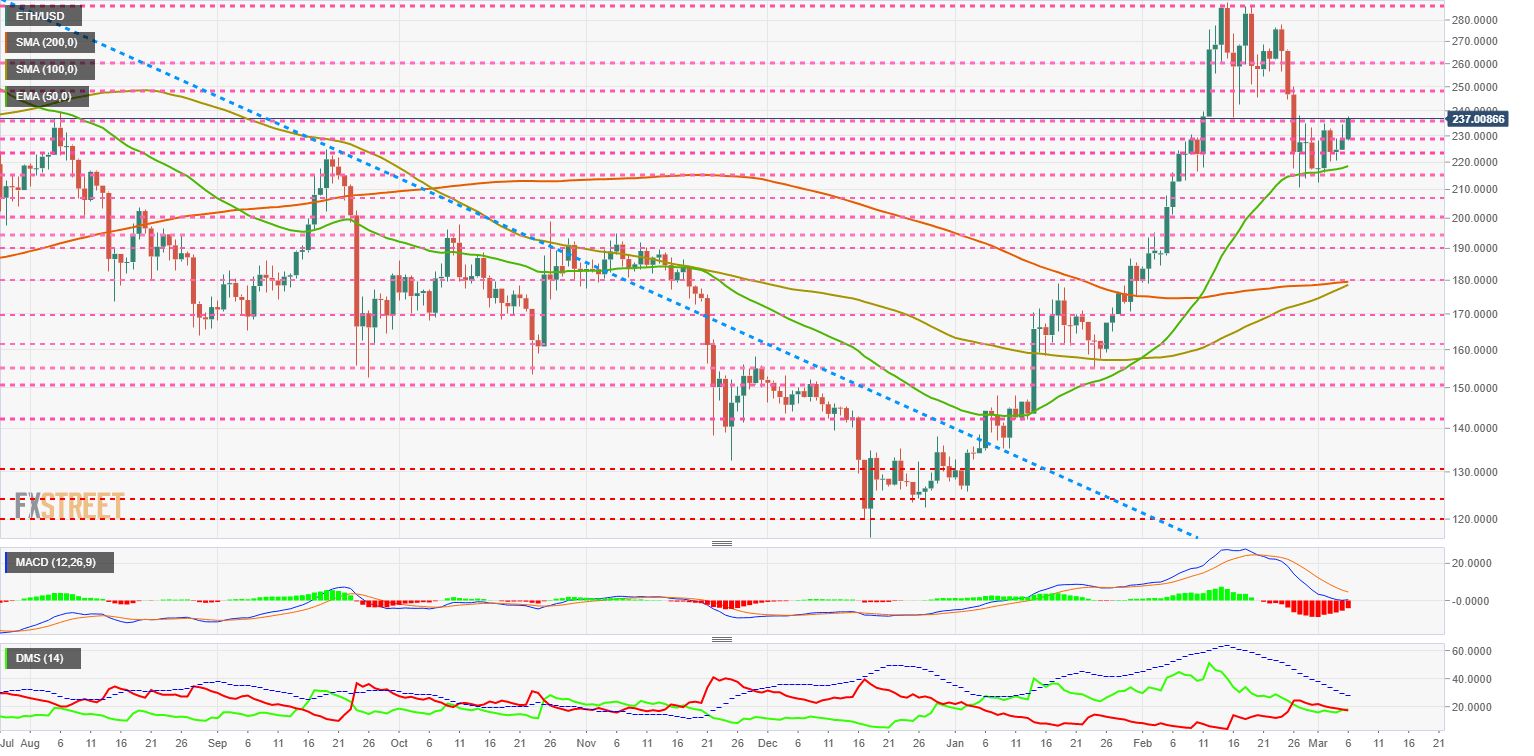 The MACD on the daily chart changes its direction upwards. The current move is above the neutral line, a very positive factor in the short term.
The DMI on the daily chart shows how is set the balance between the two sides of the market. By projecting the lines, it seems very likely that the bulls will have a chance to take control of the ETH/USD pair.
XRP/USD Daily Chart
The XRP/USD pair is currently trading at the price level of $0.2432 as it continues to attempt to overcome price congestion resistance at $0.25. The critical bullish target is to break out of the EMA50 and the SMA200 at the price level of $0.253.
Above the current price, the first resistance level is at $0.25, then the second at $0.253 and the third one at $0.27.
Below the current price, the first support level is at $0.238, then the second at $0.233 and the third one at $0.23.
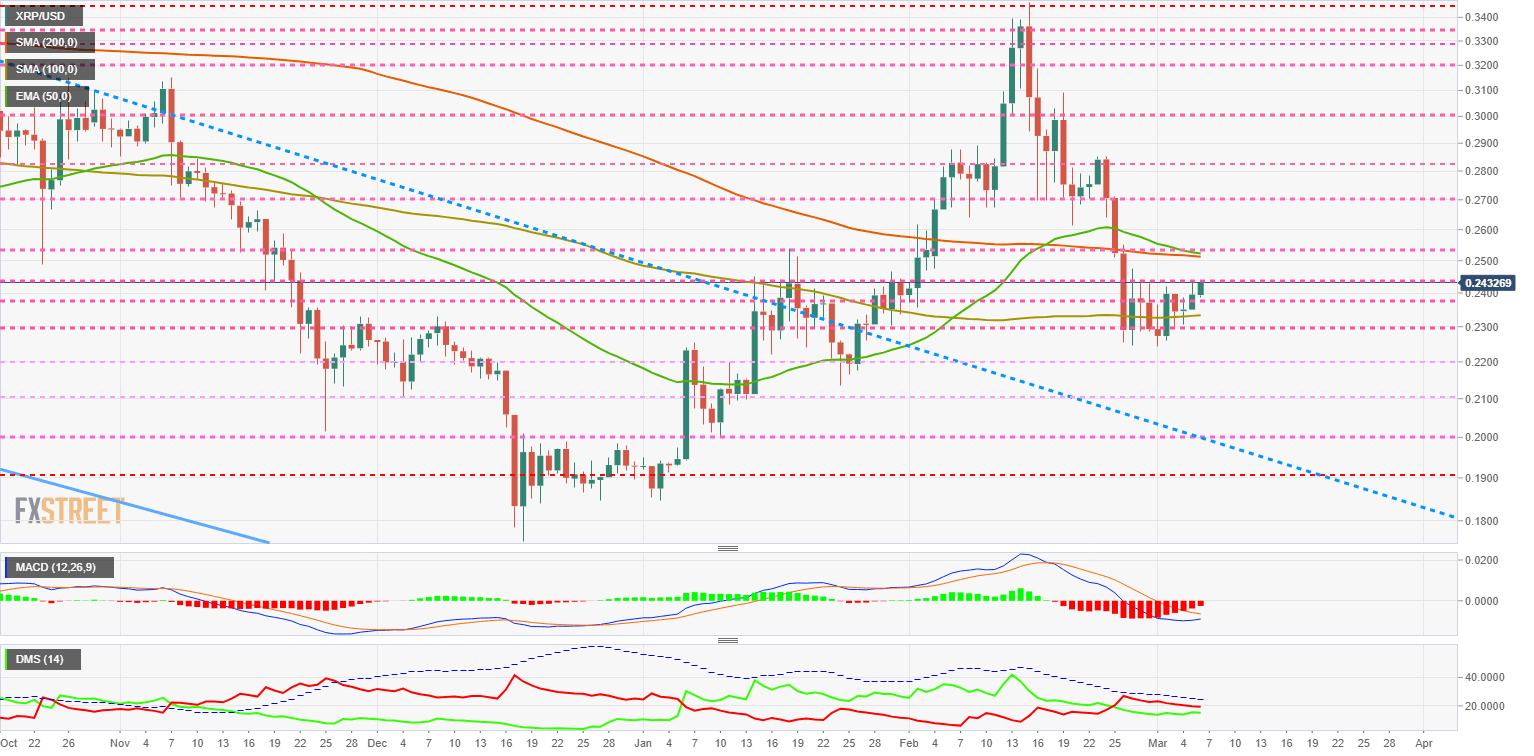
The MACD on the daily chart shows a pre-crossover profile on the upside. If this bullish cross occurs, you will quickly find the neutral level, which could halt the advance.
The DMI on the daily chart shows a continuous profile of the balanced position between the two sides of the market. The proximity of the ADX line may favor a violent breakout in either direction.
Get 24/7 Crypto updates in our social media channels: Give us a follow at @FXSCrypto and our FXStreet Crypto Trading Telegram channel
