- Bitcoin price is witnessing a quick reversal after tagging the Feb 28 swing low at $43,021.
- Ethereum price surged roughly 9% after hitting $3,123, while the rest of the market follows suit.
- XRP price is currently trying to flip a critical supply zone into a demand barrier that could serve as a foothold for its upcoming bull run.
Bitcoin price showed a temporary spike in buying pressure after initially crashing on May 12, but the sellers overwhelmed the bulls, leading to a secondary crash. BTC briefly sliced through a level last seen in early February, but the bid orders have pushed the flagship crypto higher.
This sudden surge in bullish momentum temporarily showed that buyers are taking back control.
Elon Musk strikes again
Tesla CEO Elon Musk’s ambiguous reply, “Indeed,” to a tweet might have caused the Bitcoin price to crash again.
Almost 12 hours after his cryptic tweet and a rough 8% sell-off in BTC price, Musk confirmed that “Telsa has not sold any Bitcoin.”
This is not Musk’s first comment that has stirred the cryptocurrency markets. In fact, his latest tweets regarding Bitcoin’s block size, fees and transaction speed have caused enthusiasts to respond to the electric vehicle manufacturer’s CEO comments.
Efforts to help the CEO better understand the inner workings of the pioneer cryptocurrency have fallen on deaf ears as Musk replied,
Obnoxious threads like this make me want to go all in on Doge.
Regardless, Bitcoin price seems to be making a comeback as it tagged a critical swing low.
Bitcoin price hints at reversal
Bitcoin price has crashed roughly 26% since May 12 as it went from $57,000 to $42,185. Interestingly, the initial sell-off coincided with a massive BTC inflow followed by Elon Musk’s tweet about Tesla not accepting BTC payments.
The recent drop sliced through the swing low established in February at $43,021 and created a new one at $42,185. So far, Bitcoin price has seen a 7% pullback, showing promise of a further climb.
As BTC trades at $45,175, investors can expect the bulls to ride this wave up by 14% to $51,540 or 18% to $55,350, which are areas of interest, seen in the chart below.
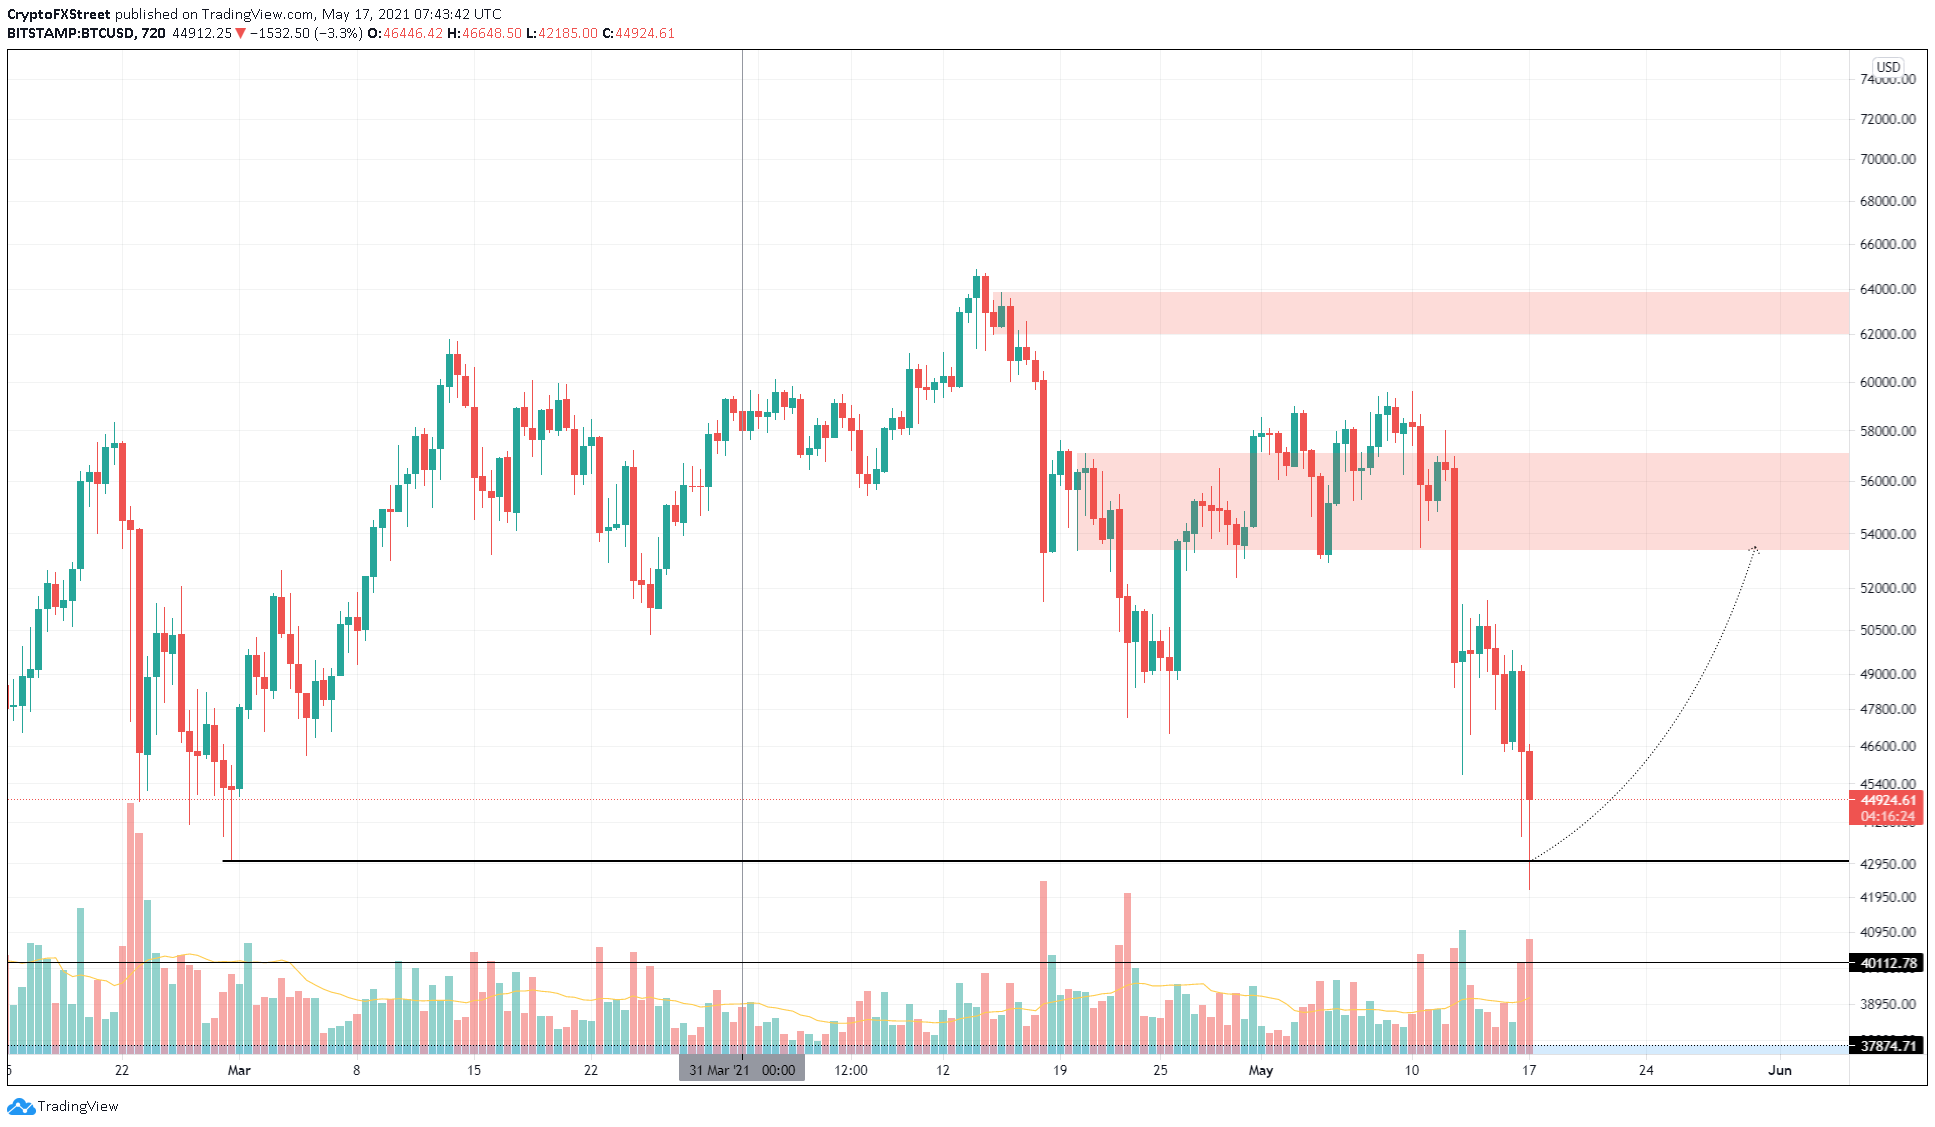
BTC/USD 12-hour chart
However, a decisive close below the February low at $43,021 will invalidate the bullish thesis and signal the presence of sellers.
Such a move would trigger a 6.8% downtrend to the immediate support level at $40,112.
Ethereum price takes point
Ethereum price shows relatively higher buying activity as it surged roughly 14% from its recent swing low. This move suggests that ETH’s recovery will be much faster than the flagship crypto’s.
At the time of writing, Ethereum price is currently testing the resistance level at $3,587. A decisive close above this barrier could trigger a 7% upswing toward a demand zone flipped on May 15 to a supply barrier that extends from $3,818 to $3,985.
If the buyers manage to slice through the upper boundary of the said ceiling, it is more than likely that ETH could rise another 10% to retest its all-time high at $4,380.
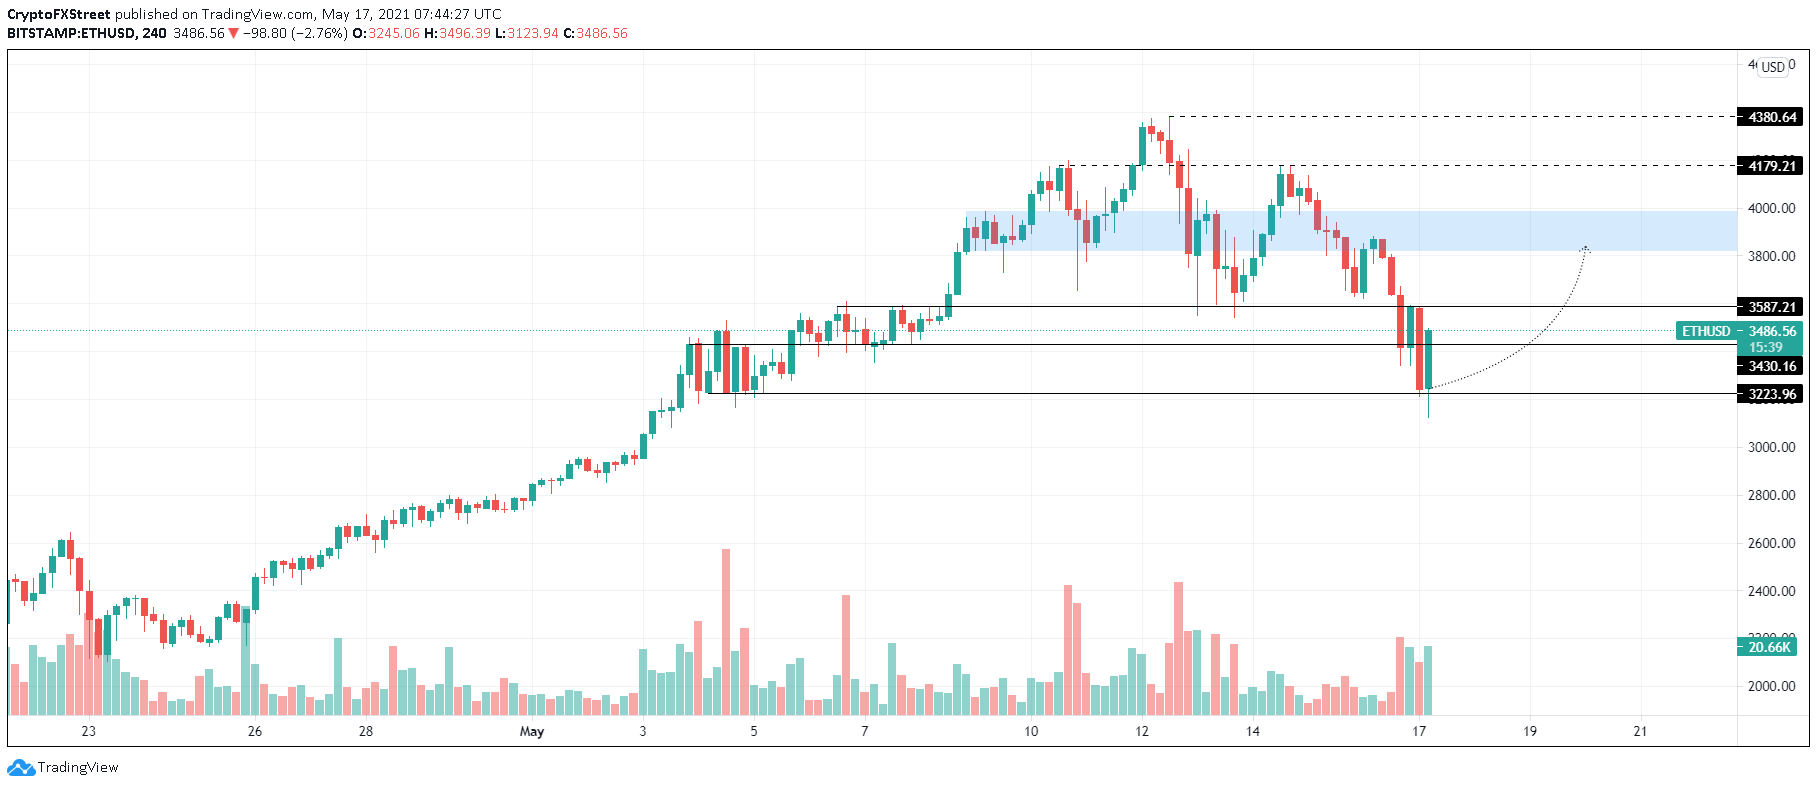
ETH/USD 4-hour chart
While the upswing seems to be going well for Ethereum, a breakdown of $3,223 will spell trouble for the smart contract token. This move would invalidate the optimistic outlook and kick-start a 7% downward move to $2,985.
Ripple buyers content to take control
Ripple price is currently testing the upper boundary of a supply zone that stretches from $1.340 to $1.477. A decisive 4-hour candlestick close above this area of resistance will confirm the upswing. However, if the bid orders pile up, creating a higher high above $1.653 will ensure that the buyers are ready to push the remittance token higher.
In such a case, XRP price could surge 7% to tag the 200% Fibonacci extension level at $1.769. Following this, the critical areas of interest include $1.889 and $1.985.
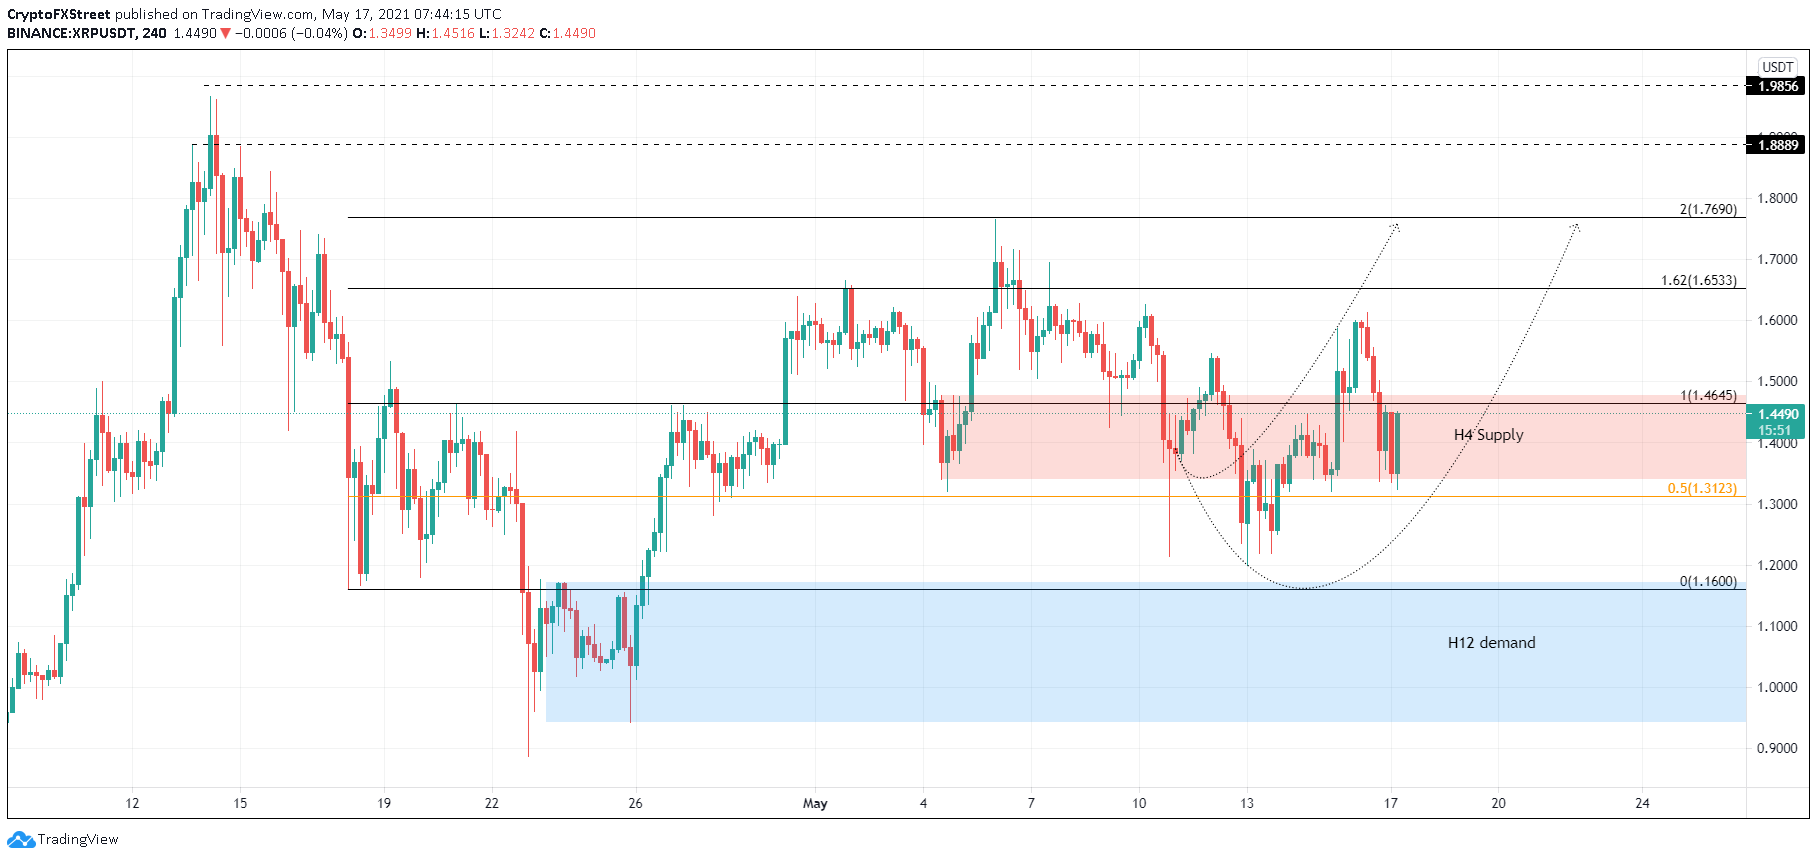
XRP/USDT 4-hour chart
A sudden sell-off that pushes XRP price toward the demand zone extending from $0.941 to $1.172 is not bearish as it provides liquidity. If this were to happen, Ripple would see a quick bounce after a brief entry into this support area.
A potential spike in selling pressure that pushes XRP price below $0.941 will invalidate the bullish thesis and invoke a new downtrend to $0.886.
