- Bitcoin is holding firmly to the support above $19,000, but its ascending wedge pattern formation is a bearish signal.
- Ethereum eyes $600 after closing the day above the 50 SMA on the 4-hour chart.
- Ripple forms a double-bottom pattern ahead of a possible rebound to price levels beyond $0.6.
The widespread crypto correction in the market seems to have humbled the bulls who outperformed themselves in November and the first week of December. The majority of crypto assets have remained sluggish since the losses incurred last week.
Ripple is among the worst hit, losing over 17% in seven days and 8% in the last 24 hours. On the other hand, Bitcoin continues to hold between $19,000 and $19,500, while Ethereum is above $580, but upward movements are limited under $600.
Interestingly, some altcoins in the top 50 seem to have ignored the widespread bearish wave, recording incredible double-digit gains. For instance, UMA is up 32% to trade at $9.7, Kusama up 12% to exchange hands at $56.6 and Zilliqa has spiked 15.6% to trade at $0.037.
Bitcoin seems to be delaying the inevitable breakdown
The flagship cryptocurrency has remained sluggish between $19,000 and $19,500. Such choppy markets are difficult to trade for both the bears and the bulls. Therefore, everyone seems to be waiting for a confirmed breakout above $19,500 or a breakdown under $19,000.
The formation of an ascending wedge pattern hints at a potentially massive correction from the current price level. This bearish outlook forms when an asset’s price ascends with pivot highs and lows while converging at an apex.
A breakdown tends to occur before the trendlines cross. An ascending wedge breakdown is usually confirmed by decreasing volume (highlighting a divergence between volume and price). Breakdowns are generally fast and drastic, and could see Bitcoin dive to refresh tentative support levels at $18,000 and $17,500, respectively.
%20(93)-637437094521331412.png)
BTC/USD 4-hour chart
On the upside, Bitcoin is likely to pull to higher levels, perhaps beyond $20,000 if the price closes the day above $19,500. If push comes to shove, defending support at $19,000 is still a relatively bullish signal.
Ethereum upswing depends on a crucial support level
Ether appears to be defying the bearish outlook after holding above the 50 Simple Moving Average. A delay in recovery is anticipated at $590 but once broken, Ethereum could spike to $600 and perhaps extend the bullish leg towards $620.
The gradually building bullish grip seems to have been validated by the Relative Strength Index after bouncing off support at the midline. This indicator tracks the strength of a trend and whether an asset is overbought or oversold. For now, room for growth is available until the RSI hits the overbought region.
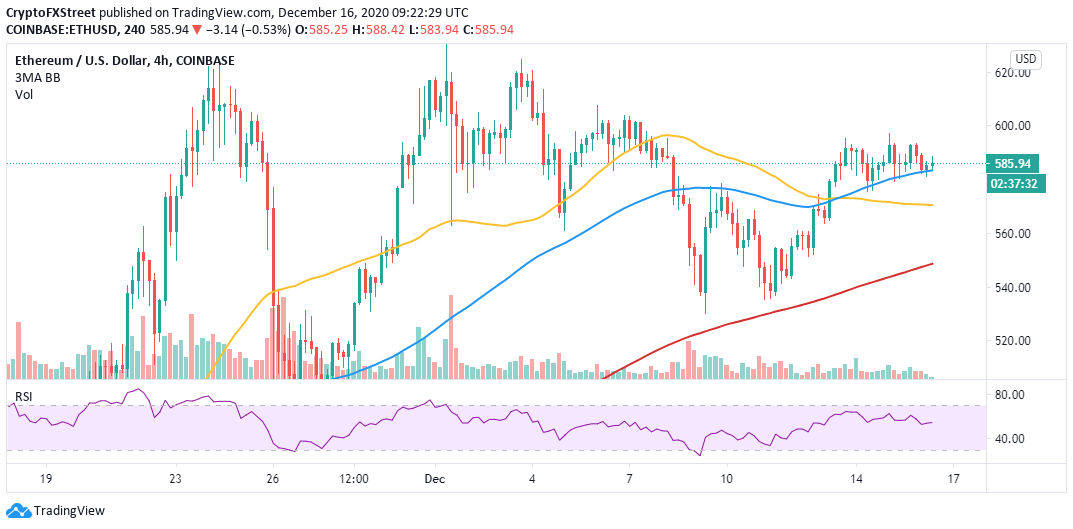
ETH/USD 4-hour chart
A bearish outlook would come into the picture if Ether sliced under the 50 SMA. Moreover, closing the day below the next support at $580 may see sell orders surge. If enough volume is created, a breakdown back to $540 will most likely occur.
Ripple on the brink of accelerating upwards
XRP bulls are nursing wounds after suffering dearly from the extended downtrend. A monthly low seems to have been reached at $0.43, hinting at a possible local bottom. The region also happens to coincide with another bottom, formed during the correction in November.
If the double-bottom pattern support holds, Ripple may rebound extensively, perhaps past $0.5 and toward $0.6. Some resistance should be anticipated at the 200 SMA ($0.5), the 50 SMA ($0.525) and the 100 SMA ($0.575). The oversold RSI adds credibility to the bullish outlook, hinting at bullish reversal is around the corner.
%20(31)-637437096225405083.png)
XRP/USD 4-hour chart
On the downside, the bearish outlook may continue to dominate for the rest of this week if the double-bottom pattern support is invalidated. The declines that come into play could push XRP to $0.4 and $0.35 before a significant rebound occurs.
