- Sentiment level nears euphoria adds bearish potential to the crypto market.
- Ethereum tests $400 in the Asian session, fails at European opening.
- Ripple falls decisively and returns doubts to the XRP/USD pair.
The crypto market continues to push upwards despite strong overbuying and over-optimism in the market. Today the Ethereum gives an unexpected change of direction and accumulates a 5% gain against Bitcoin in only two sessions.
Ether’s upward movement puts on the table a bullish terminal pattern that could take the market to levels far above the current ones.
Trading in these market conditions is not as safe as the current price levels admit significant price corrections as being highly probable. If on the contrary, the crypto board decides to move up, the rise can be vertical and leave the current price levels as an anecdote.
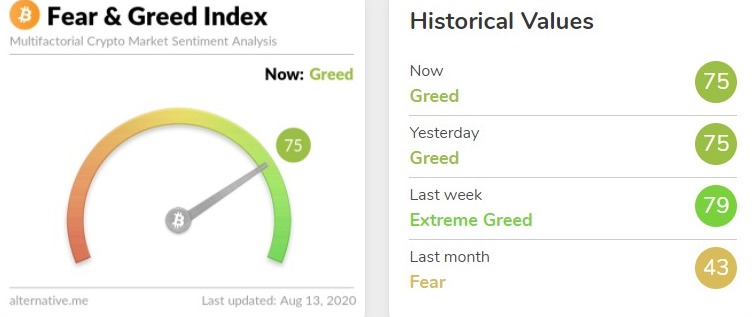
Market sentiment is unchanged from yesterday and remains at level 75, one point below the extreme optimism level. This level of complacency remains very high and dangerous.
Clues to such a puzzle may come from the side of the dominance charts.
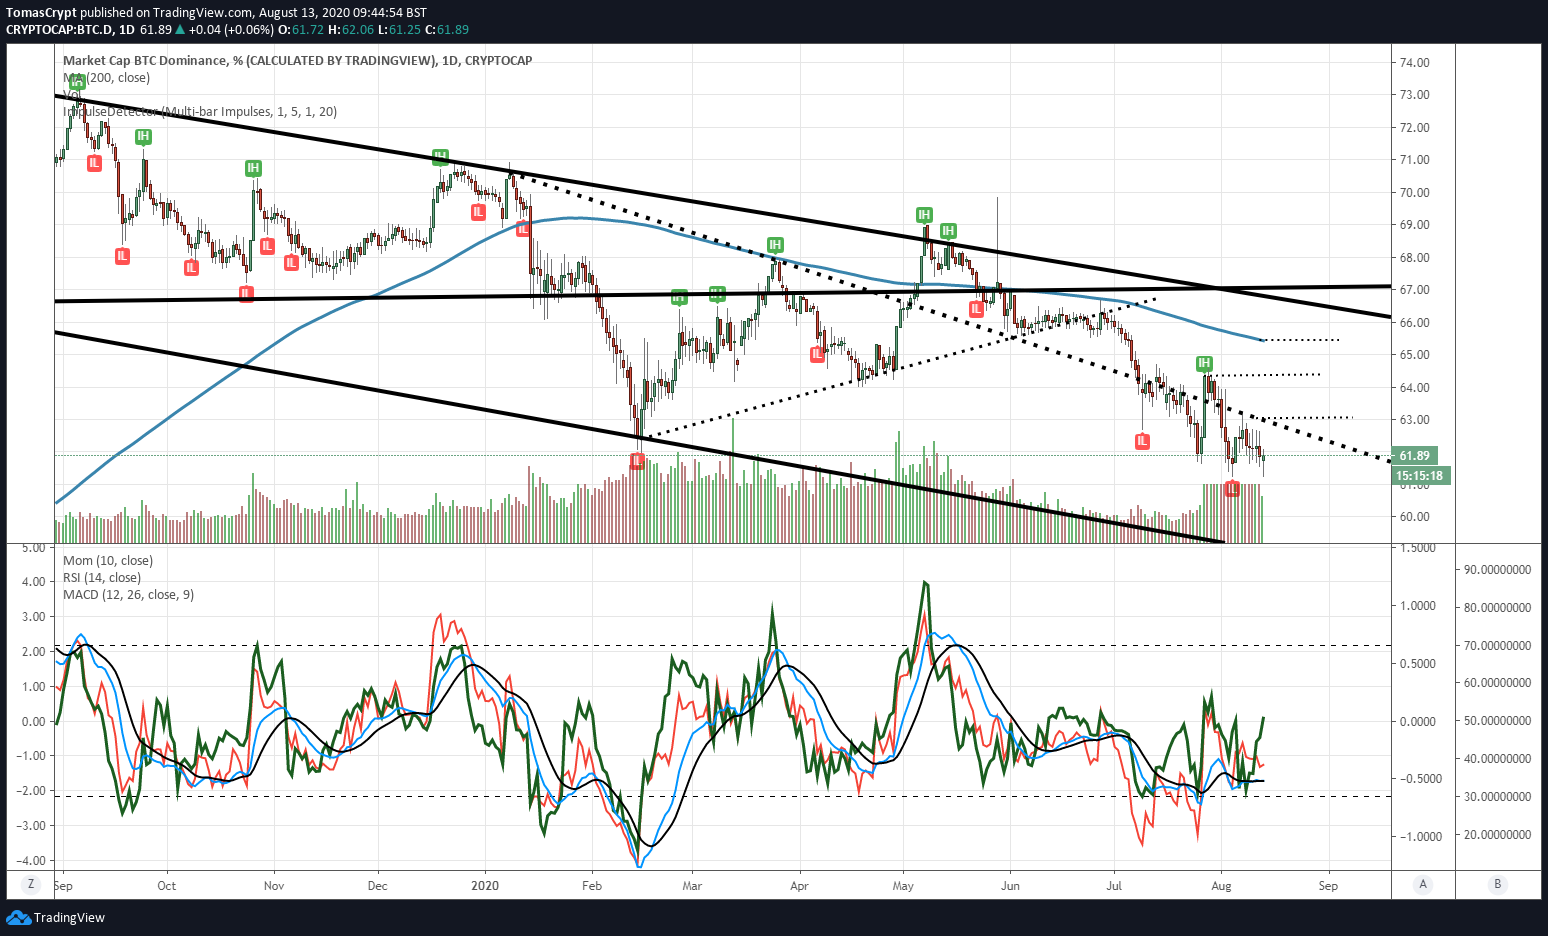
In the case of Bitcoin, the dominance level is now at 61.6%, and it’s trying to form a technical floor. Below the 61.24% level, the positions could rotate actively towards Ether and the rest of Altcoins.
ETH/BTC Daily Chart
The ETH/BTC pair is currently trading at the price level of 0.0339 after a first afternoon attempt to break the resistance level at 0.034.
Above the current price, the first resistance level is at 0.034, then the second at 0.0353 and the third one at 0.038.
Below the current price, the first support level is at 0.0328, then the second at 0.0307 and the third one at 0.0295.
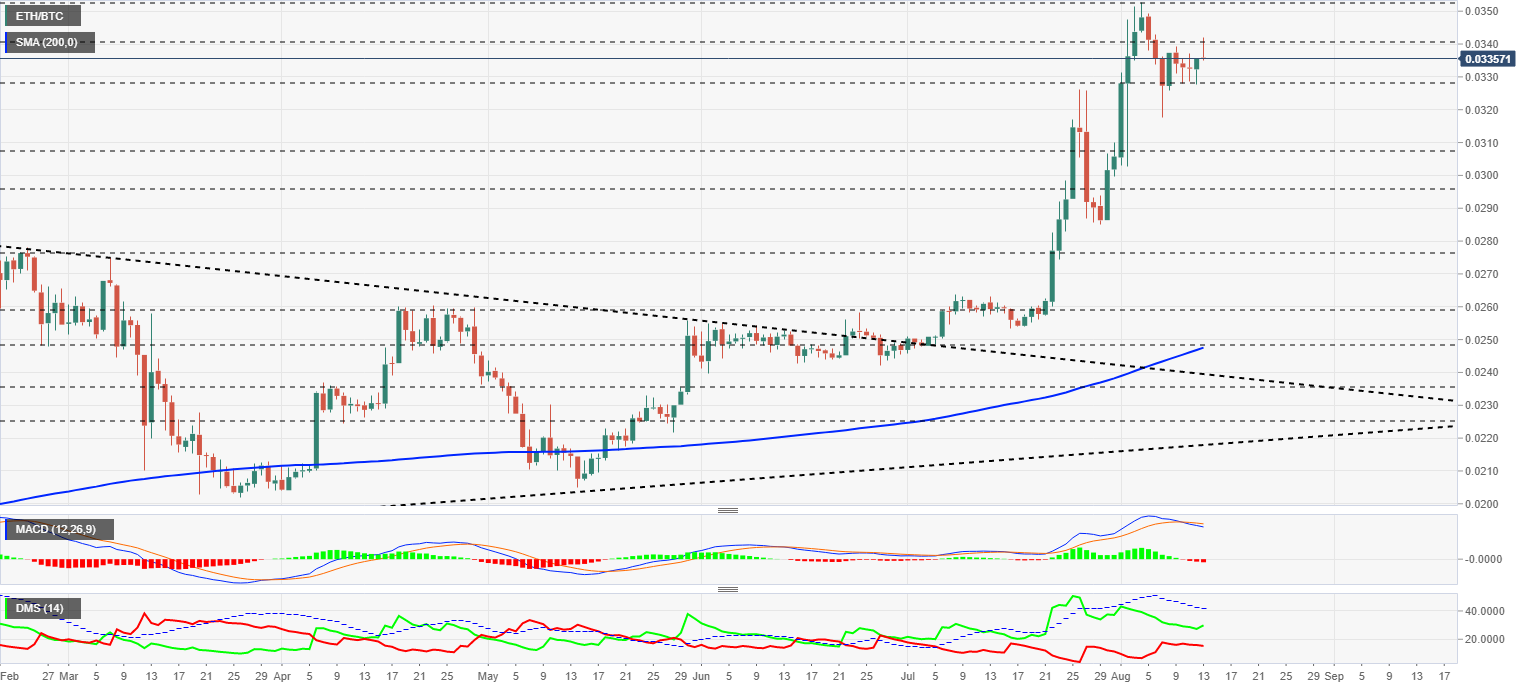
The MACD on the daily chart is losing its downward slope due to yesterday’s rally and today’s opening. The bearish cross has not undone, and the natural price movement should be downward.
The DMI on the daily chart shows a bullish cross has formed on the bullish side. The bears are not replicating the downward movement, an interesting detail for the short term.
BTC/USD Daily Chart
The BTC/USD pair is currently trading at $11512 and remains above the last resistance level of $11500. BTC/USD is limited at the top by the trend line that originated in early March.
Above the current price, the first resistance level is at $12000, then the second at $12350 and the third one at $12500.
Below the current price, the first support level is at $11350, then the second at $10400 and the third one at $9500.
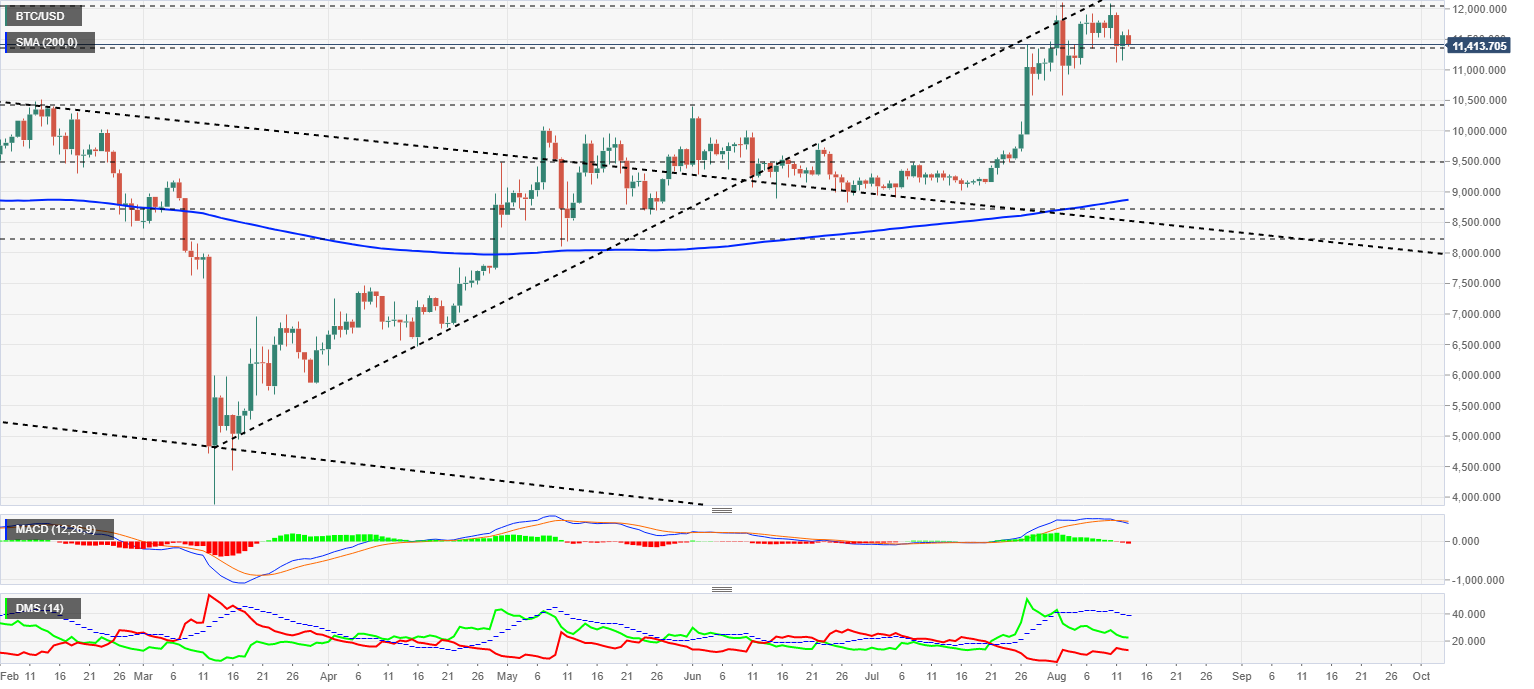
The MACD on the daily chart continues to point downward although yesterday’s rally has softened the aggressive downward profile.
The DMI on the daily chart shows bulls and bears at the same levels as in previous days, with no changes to provide information for the short term.
ETH/USD Daily Chart
The ETH/USD pair is currently trading at $388.4 and is losing its gains during the Asian session.
Above the current price, the first resistance level is at $412.7, then the second at $455 and the third one at $500.
Below the current price, the first support level is at $360, then the second at $320 and the third one at $290.
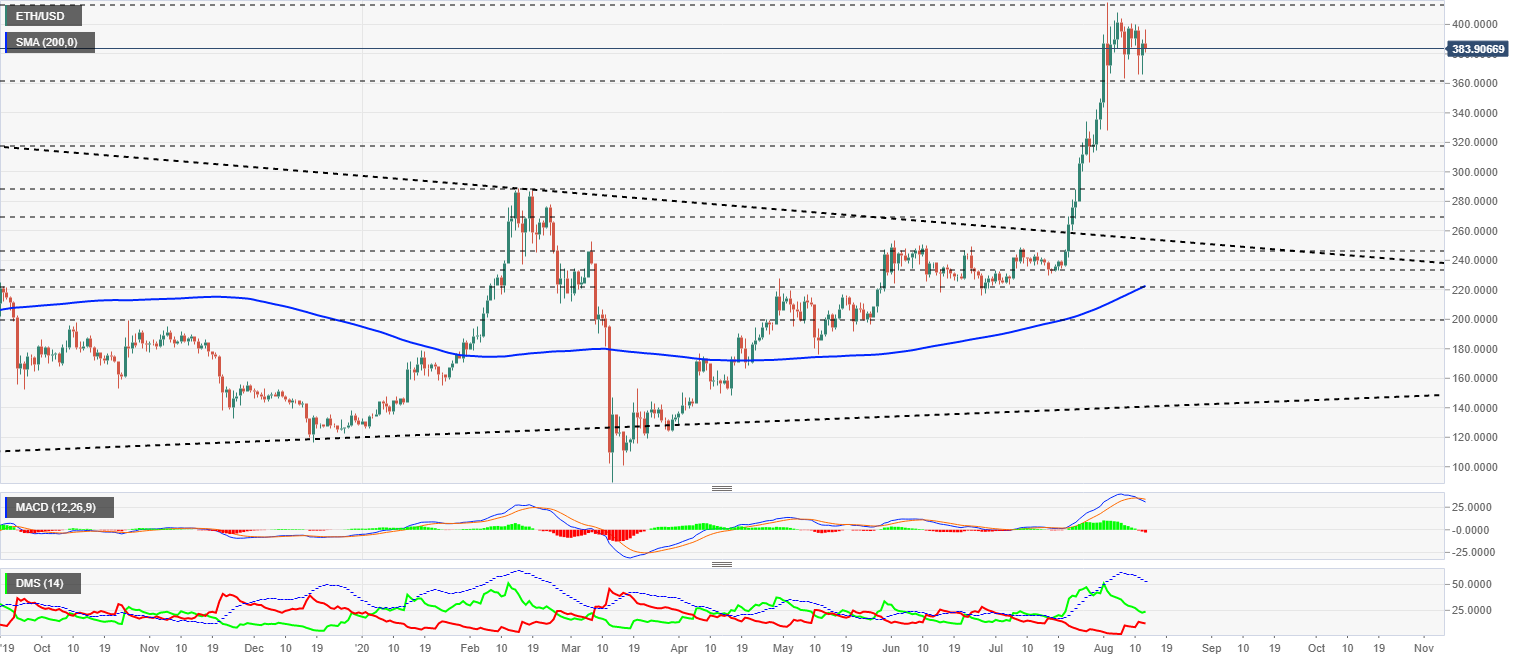
The MACD on the daily chart continues the bearish trend that was confirmed yesterday. The most likely price development for ETH/USD is bearish.
The DMI on the daily chart shows the bulls moving slightly higher, a move that the bears are replicating in a downward direction, aware of the underlying upward force in the ETH/USD pair.
XRP/USD Daily Chart
The XRP/USD pair is currently trading at $0.2768, and this raises doubts as to the strength of the previous Ripple’s rise.
Above the current price, the first resistance level is at $0.285, then the second at $0.305 and the third one at $0.336.
Below the current price, the first support level is at $0.265, then the second at $0.235 and the third one at $0.23.
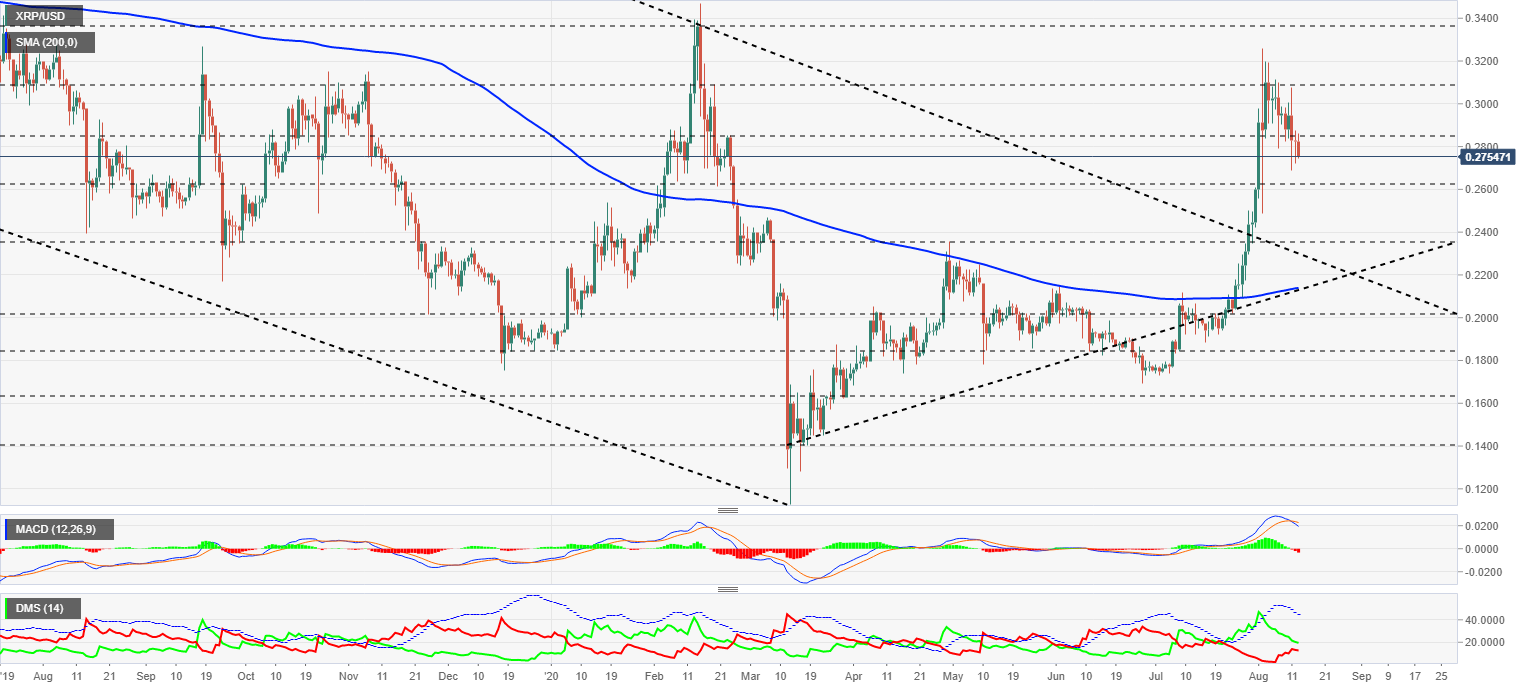
The MACD on the daily chart shows an acceleration in the indicator’s bearish trend. The most likely development for Ripple is bearish in the short term.
The DMI on the daily chart shows bulls and bears about to cross. The confrontation between the two sides of the market will increase the volatility of the XRP/USD pair.
