- Tron has been trending in a narrow channel between $0.027 and $0.025.
- The buyers are attempting a comeback in the hourly chart.
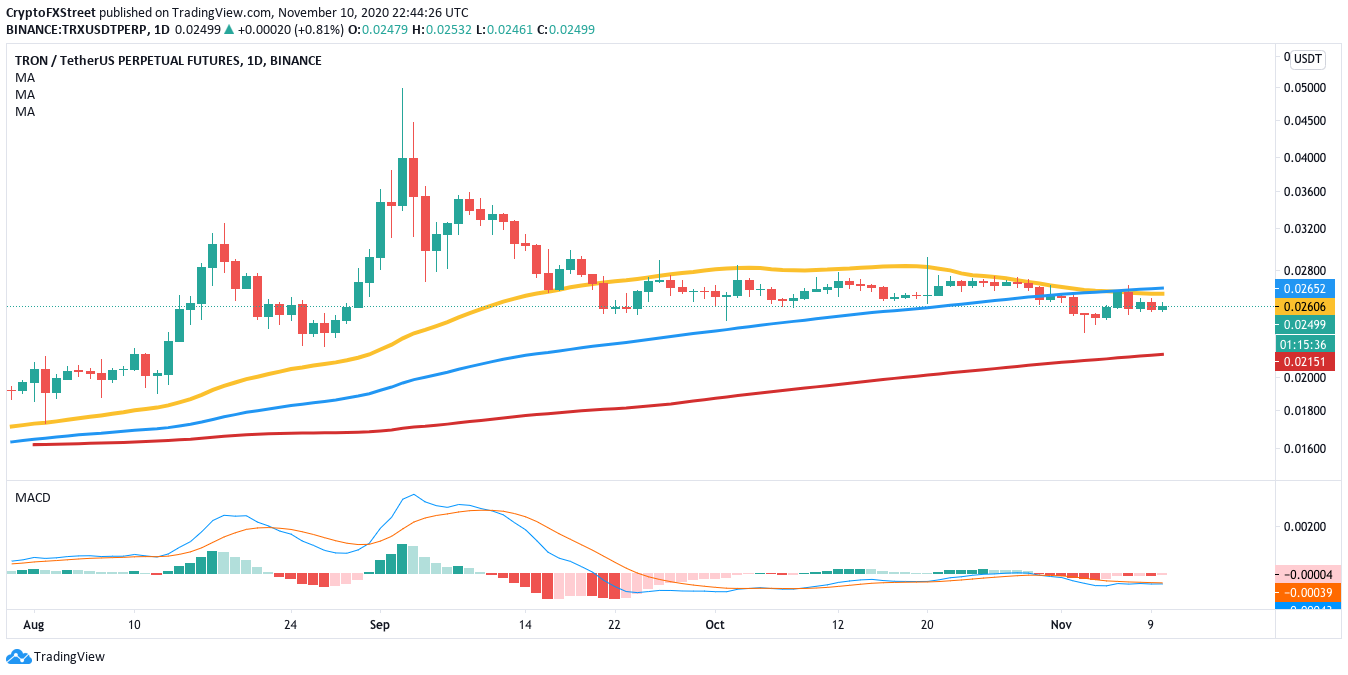
Tron reached a high of $0.40 on September 3, TRX dropped to $0.025 over the next 18 days. Following that, the price trending in a narrow channel between $0.027 and $0.025, facing multiple rejections at the 50-day SMA.
Growth stunted by rejections
On November 5, the 100-day SMA crossed above the 50-day SMA, forming a bearish cross pattern. The MACD has also been trending in the red since October 30. These indicators tell us that further bearish price action is expected. If that does happen, it could be pretty catastrophic for the buyers as the only viable support wall on the downside lies at the 200-day SMA ($0.021).
TRX/USD daily chart
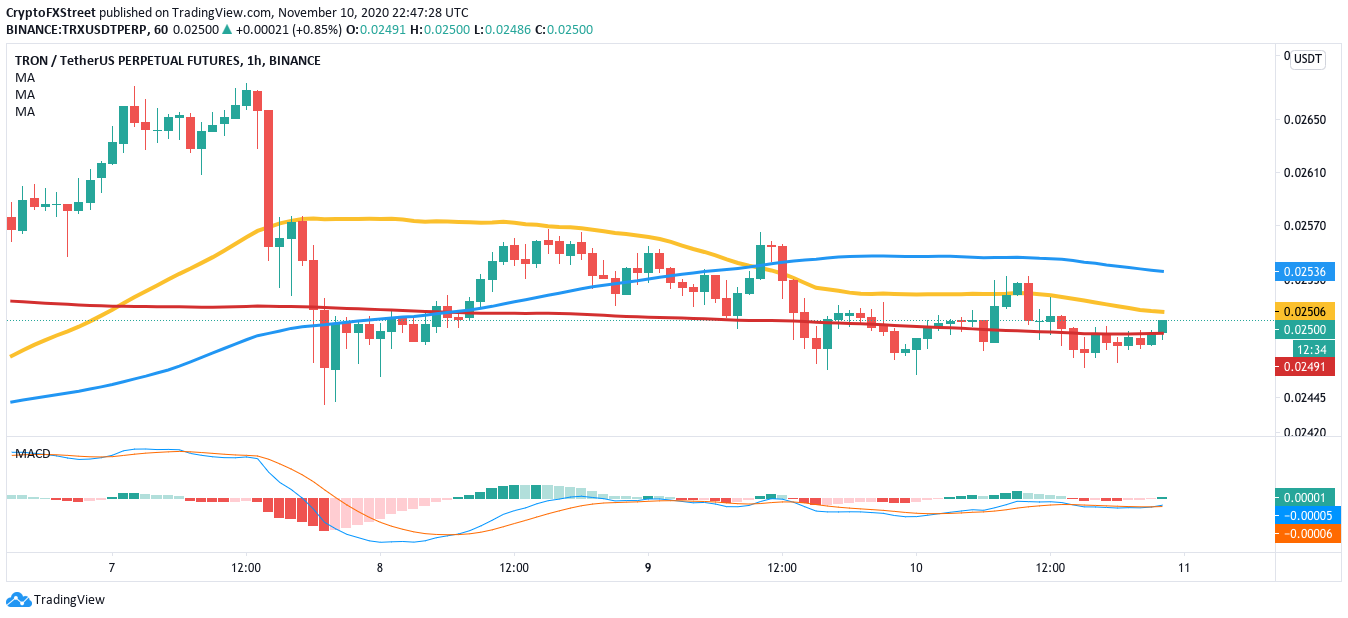
Upon shortening our timeframe, we can see that the buyers attempt to stage a comeback of sorts. The latest candlestick has managed to cross above the 200-bar SMA ($0.025) and is now aiming for the 50-bar SMA ($0.02506). If it manages to do so, the bulls will then have the license to conquer the 100-bar SMA ($0.0254). The MACD in this time frame has moved from bearish to bullish.
TRX/USD hourly chart
So, while the buyers aim to make some gains in the hourly chart, the overall outlook remains bearish for the “Ethereum killer.” The 50-day SMA ($0.026) and 100-day SMA ($0.0265) remain two key levels that seem unsurpassable. These two barriers are strong enough to absorb a tremendous amount of buying pressure.


