- Binance launched TRX futures trading with up to x75 leverage.
- TRX/USD has gained over 11% in recent 24 hours and bumped into a resistance.
TRX now the 10th largest digital asset with the current market value of $1.3 billion, has gained over 11% in the recent 24 hours to trade marginally below $0.0170 at the time of writing. While the coin has retreated from the intraday high of $0.0175, it is still in a green zone, moving within the short-term bullish channel. Tron has increased nearly by 30% since the beginning of the year amid a major improvement of investors’ sentiments on the cryptocurrency market.
TRX futures available on Binance
As of today, January 15, TRX is available on Binance Futures with the leverage up to x75. The exchange announced the upcoming launch of new contracts on Tuesday. Earlier this year, Binance launched futures on XRP and LTC. Notably, the exchange introduces the price limits of +/-1% for the first 15 minutes of trading to prevent price manipulations. Leveraged contracts are considered risky instruments especially during high volatility periods as the trades may result both in great profits and significant losses.
Binance warned traders that “in the event of extreme price movement, there is a chance that all margin balance in the futures wallet may be liquidated.”
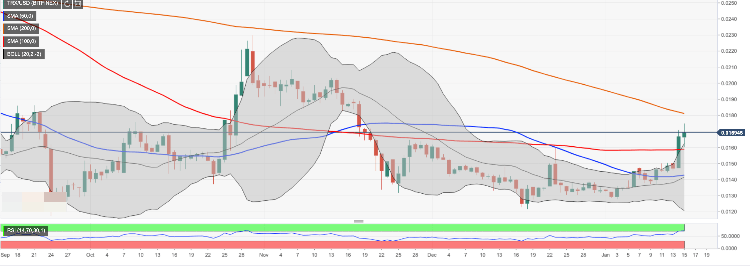
TRX/USD: technical picture
From the technical point of view, the initial resistance for TRX/USD is created by a $0.0170 handle reinforced by the upper line of 4-hour Bollinger Band. We will need to see a sustainable move above this handle for the upside to gain traction with the next focus on the recent high of $0.0175 followed by SMA200 daily at $0.0181. TRX/USD has been trading below this MA since the end of July 2019, which means that a sharp move above this barrier will create a strong bullish impulse.
On the downside, the initial support is created by the upper line of the daily Bollinger Band at $0.0162. Once it is out of the way, the sell-off is likely to gain traction with the next focus on $0.0156 (SMA100 daily). and $0.0153 ( the middle line of 4-hour Bollinger Band). This area is likely to slow down the bears, though if it is broken, psychological $0.0140 will become the next bears’ target.
The RSI both on intraday and daily charts stays in the overbought territory, which means that the coin is vulnerable to the downside correction; However, the indicators has yet to produce the reversal signals.
TRX/USD daily chart