- TRON price only 5% away from the 2018 all-time high at $0.100.
- Volume running more than double the daily average.
- Delicate decision facing traders today.
TRON price putting pressure on the bulls to decide between capturing a 50% gain today or waiting to see if it has the momentum to test the all-time high. Simply, risk a reversal for an extra 5%?
TRON price in the blow-off phase
For consecutive weeks this month, TRX failed to overcome the topside trend line’s resistance from August 2020 through the February high at $0.067. This week is a different story as the digital token has quickly cleared the displayed trend line and rallied through the 0.786 Fibonacci retracement of the 2018-2020 bear market at $0.080 and the highest weekly close in 2018 at $0.088.
At the time of writing, TRX is not showing signs of exhaustion, and it MAY hit the all-time high today or this week. However, it is essential to underscore that this is the blow-off move for the 2021 rally, and traders should be preparing to lock in gains.
The only clear upside target is the all-time high at $0.100.
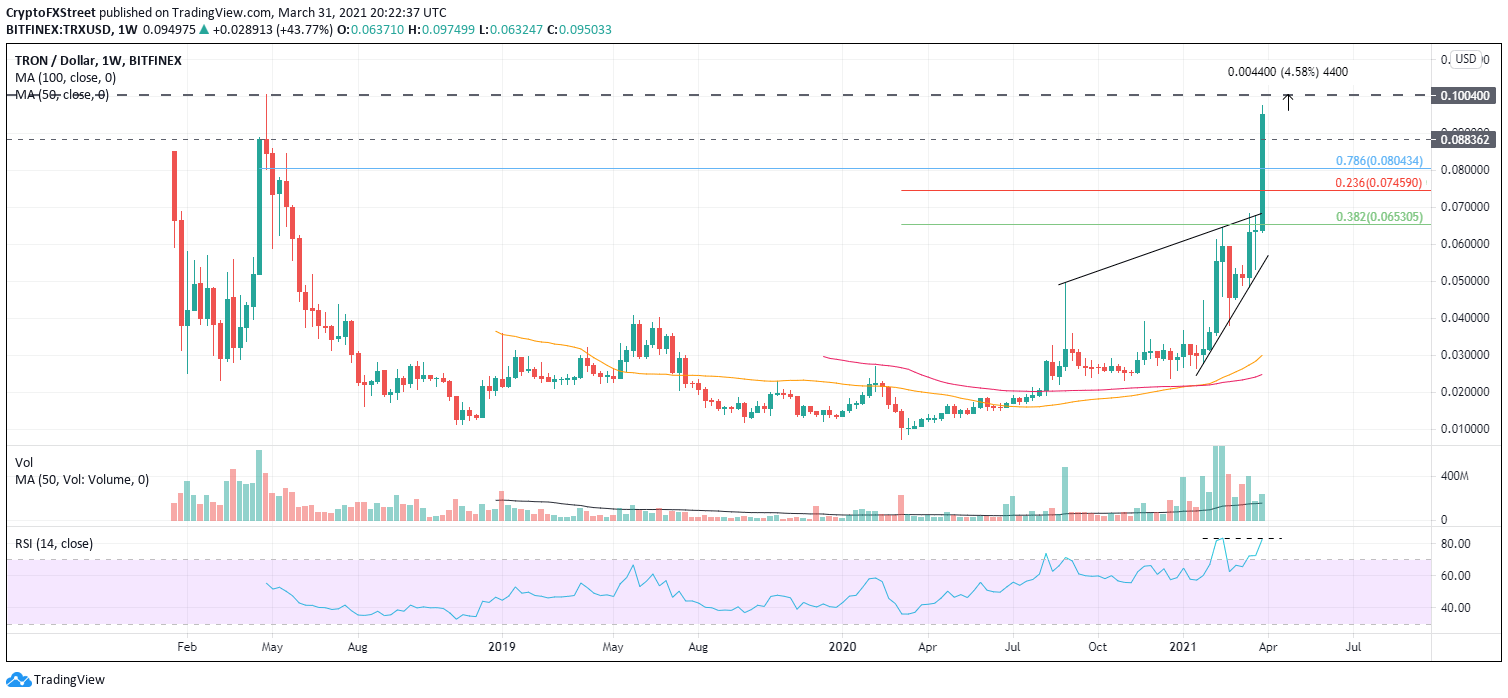
TRX/USD weekly chart
As with all trading opportunities, downside protection is critical, and traders should plot the highest weekly close of 2018 at $0.088 to start. If that fails to hold, TRX will crumble to the 0.236 Fibonacci retracement of the 2021 rally at $0.074. The topside trendline is the next support level, currently at $0.068, followed by the 0.382 retracement level at $0.065.
